You probably already crossed the word "trait" in scientific presentation or in papers, but you are still confused about what is exactly a phenotyping trait? At Hiphen, we always use the term "trait" to define all the different measurements that we can make for your plant phenotyping projects.
Generally speaking, a phenotyping trait, also called phene, is a quantitative or qualitative characteristic of an individual resulting from the expression of its genome in a given environment. This term is not restricted to plants and a trait can be determined at the scale of an organ, a plant or a canopy. The collection of traits, or phene, constitute the phenotype of the individual. In consequence, Plant phenotyping is the science of measuring traits to determine plant or canopy phenotype.
At Hiphen, we are specialist of non-destructive traits assessments thanks to our in-house technology to collect and analyze images from drones or phenomobiles. It allows to calculate traits multiple times during the season as opposed to destructive assessments. Monitoring the phenotyping allows to explain the quantitative and qualitative performance of your field. However, the term "trait" covers a lot of different reality: let's take a deep dive!
The measurement of traits with high-throughput plant phenotyping produces variables: a discrete or continuous quantity that quantifies the traits that can then be used to compare different individuals. Traits availability and the precision of the associated variables depend both on sensors' technological development and interpretation methods maturity.
However, a phenotyping trait can be from a very different nature. At Hiphen, we define categories of traits:
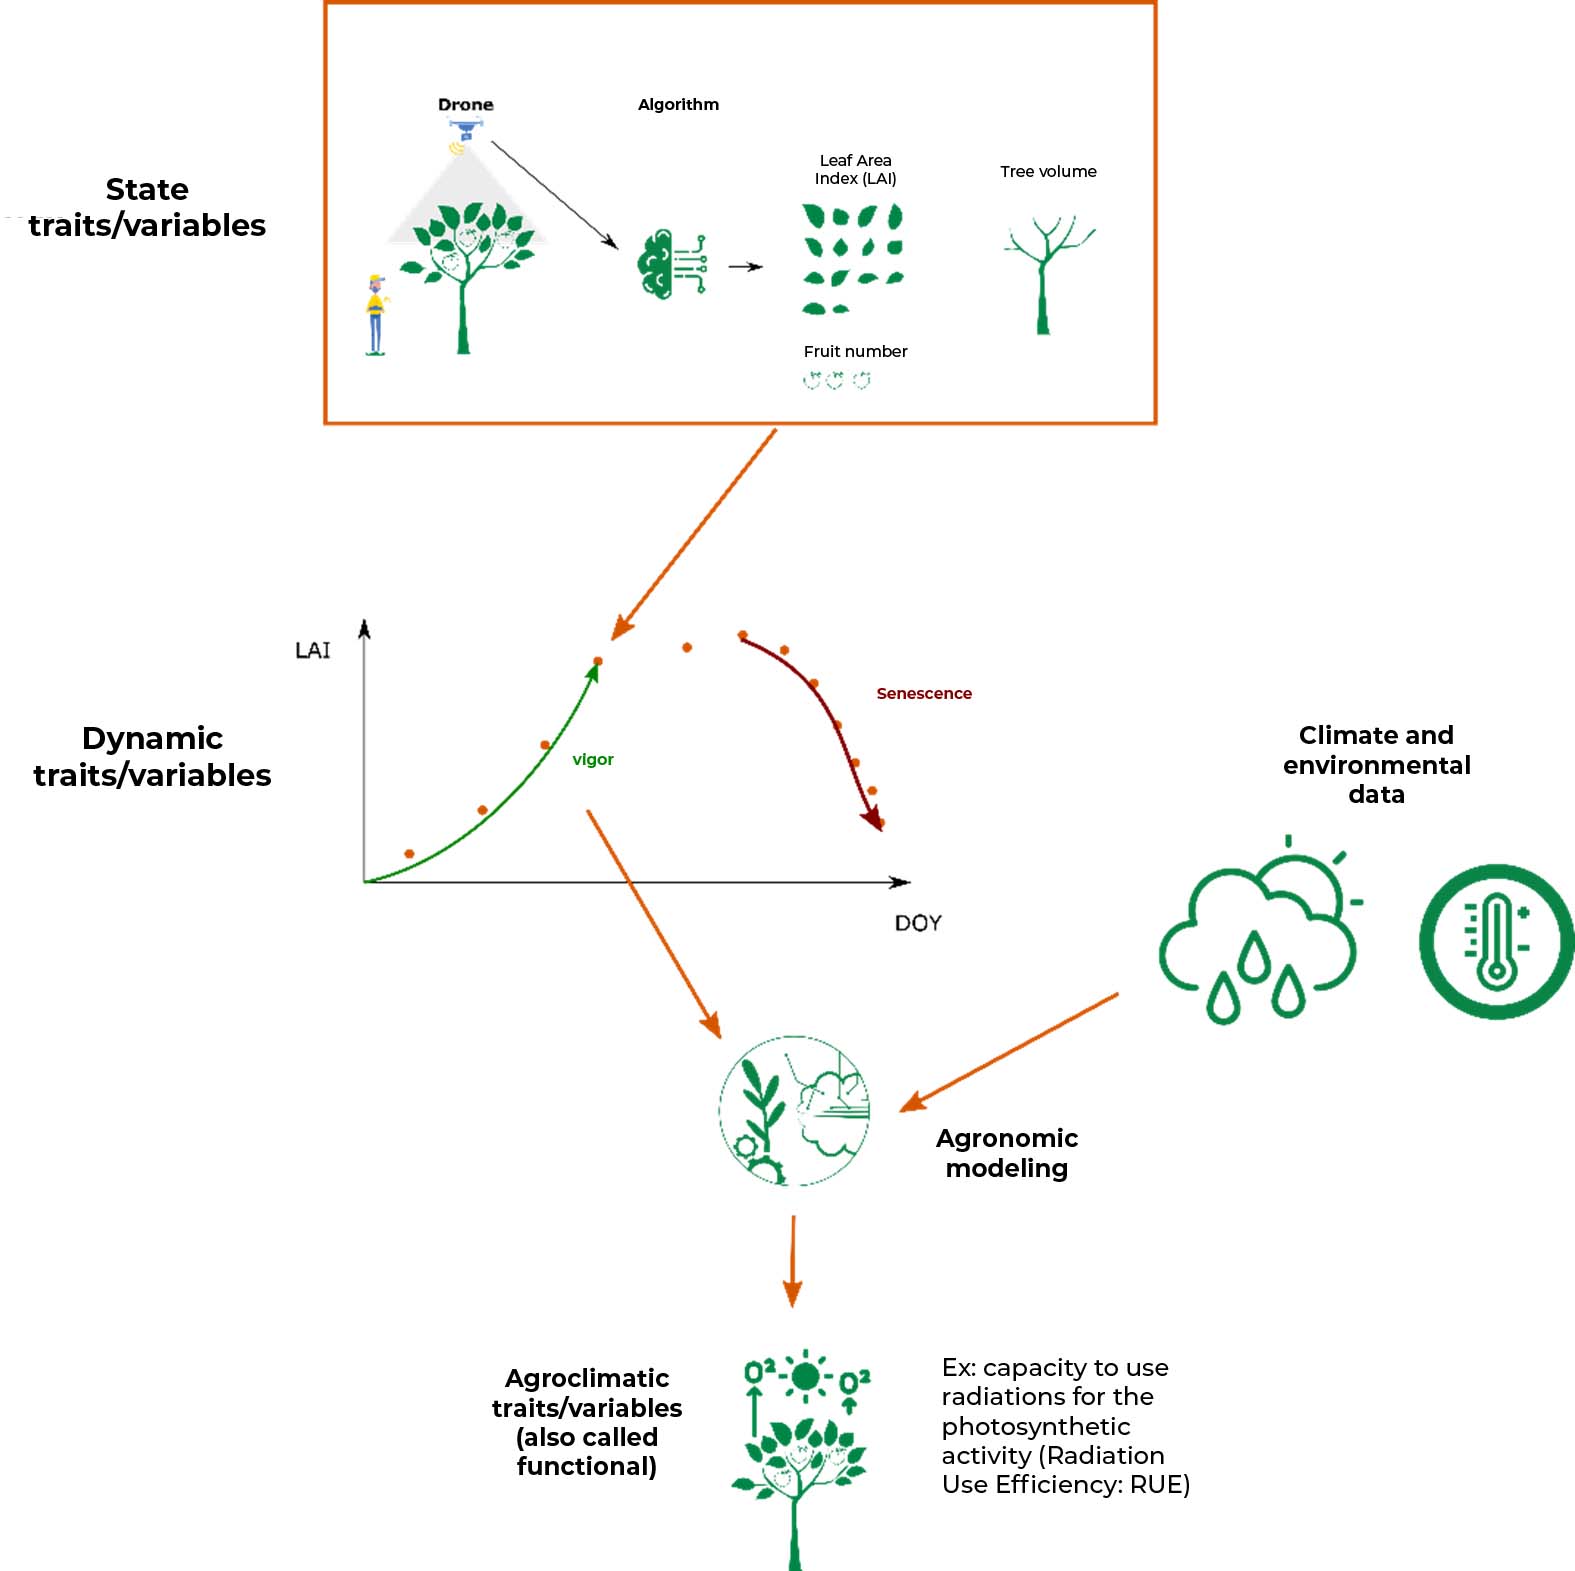
For instance, we present in the diagram how at Hiphen we will evaluate the photosynthetic efficiency of your crop. After your UAV flights, we will be able to interpret your raw data into state traits/variables (step 1) (remember, it can be biophysical, biochemical, or sanitary!). By repeating your flights during the growing season at key phenological stages we will be able to integrate over time the state traits/ variables and transform them into dynamic traits (step 2) such as vigor or senescence (stay green). We can transform these dynamic traits into true agronomical traits (step 3) by combining them with environment information using agronomic modeling. Meanwhile, you just have to relax, sit back and enjoy clean, qualitative information from your trial on our data platform: Cloverfield.
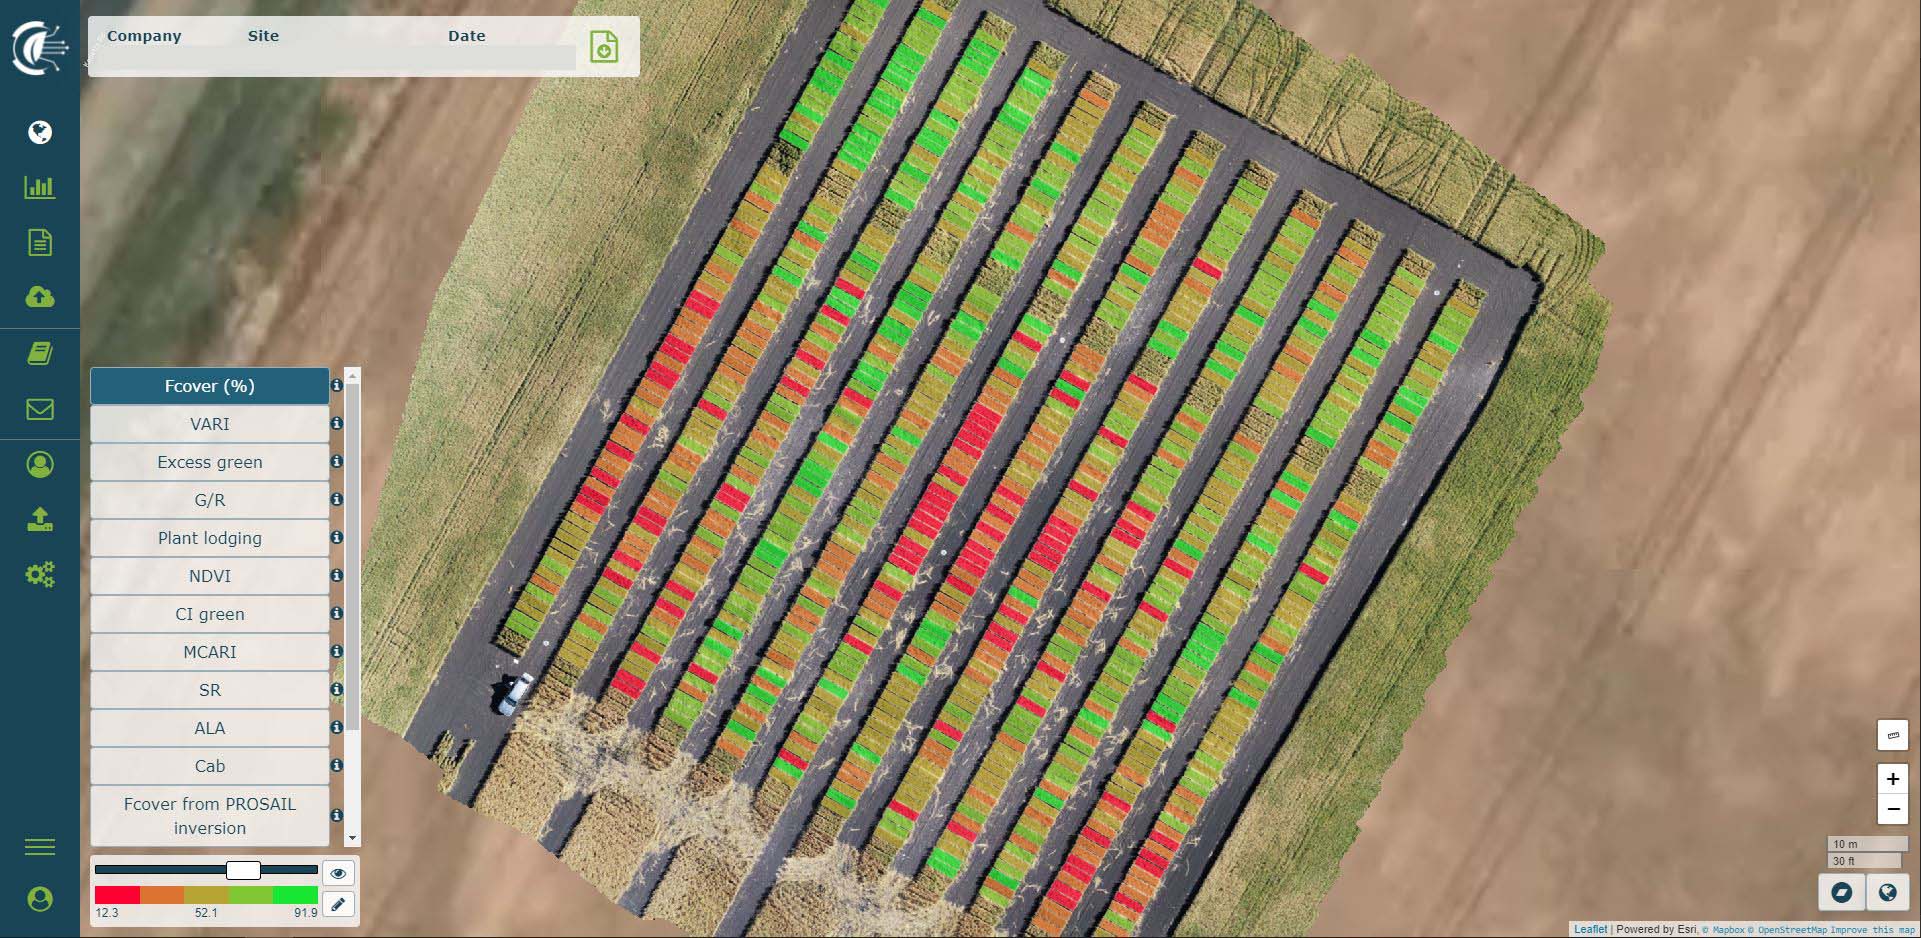
By the way, here is an example of the distribution of a trait (green fraction or Fcover here) in Cloverfield:
Feel free to contact us should you have any question about a specific phenotyping trait through our contact page. We look forward to hearing from you!
Speak soon,
Your Hiphen team.
The states traits can be measured directly on the canopy and take exactly one value at a precise time. They can be categorized into three groups:
Example of state traits/variables:
Dynamic traits are based on repeated observations of state traits. Popular dynamic traits among breeders are the early vigor or the stay green. The early vigor is the plant or canopy growth speed, while the stay green is the plant or senescent canopy rate. Specific characteristics of the plant architecture plasticity are evaluated dynamically, such as the leaf rolling. Phenological traits are also dynamic traits that are measured by detecting qualitative changes in plant morphology. In wheat, tillering, stem elongation and heading or flowering are evaluated by monitoring biophysical traits such as plant height or wheat head density.
Several definitions of functional traits exist in the literature due to the concept being explored in the context of plant phenotyping and ecology. C.M Caruso in the International Journal of Plant Science vol. 181 proposes that "functional traits are generally considered aspects of plant phenotypes that influence growth, survival, and reproduction by mediating interactions with the biotic and abiotic environment". We propose to define functional traits as traits describing canopy, plants, or organ reactions to the environment. Since they account explicitly for the environmental 17 conditions on some processes, they are expected to be less sensitive to some environmental factors. They will therefore be more heritable than most of the other traits. Efficiency traits are commonly used functional traits that evaluates the efficiency with which elements are used by the plant to grow. They include the radiation (RUE), water (WUE) and nitrogen (NUE) use efficiencies.
Before discussing the current state of play of the drone industry in agriculture, it's interesting to jump back to the roots of using drone equipment for agricultural imaging.
We can identify the birth of professional drone manufacturing back in 2010 when a few startups started to show up with the objective to bring Unmanned Aerial Vehicle (UAV) into production for business purposes. At that time, the agricultural sector started to identify use cases for drone phenotyping projects, and the most important KPI that the industry was looking for at that time was the surface coverage of the device. So basically, the early adopters wanted to be able to assess their field trials at large scale in a high-throughput fashion, and fixed-wings devices were the best-fitting equipment to match their expectations. Thus, the traits that they wanted to investigate with such drones were mainly multispectral traits for fertilization modulation purposes.
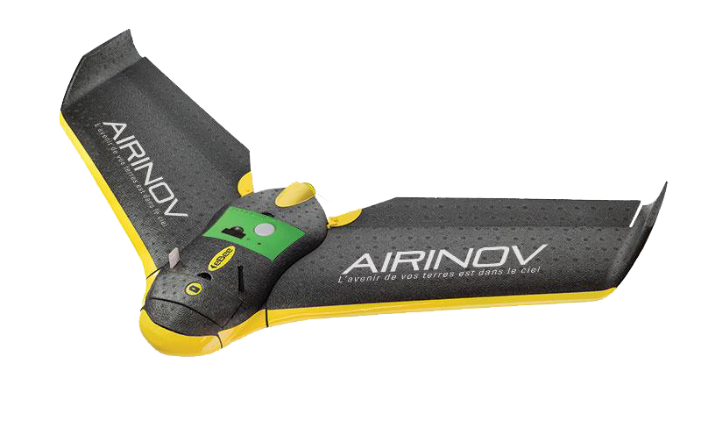

Companies such as Airinov and Delair were providing great drones at that time, but they quickly started to become outdated for crop assessment, here is why.
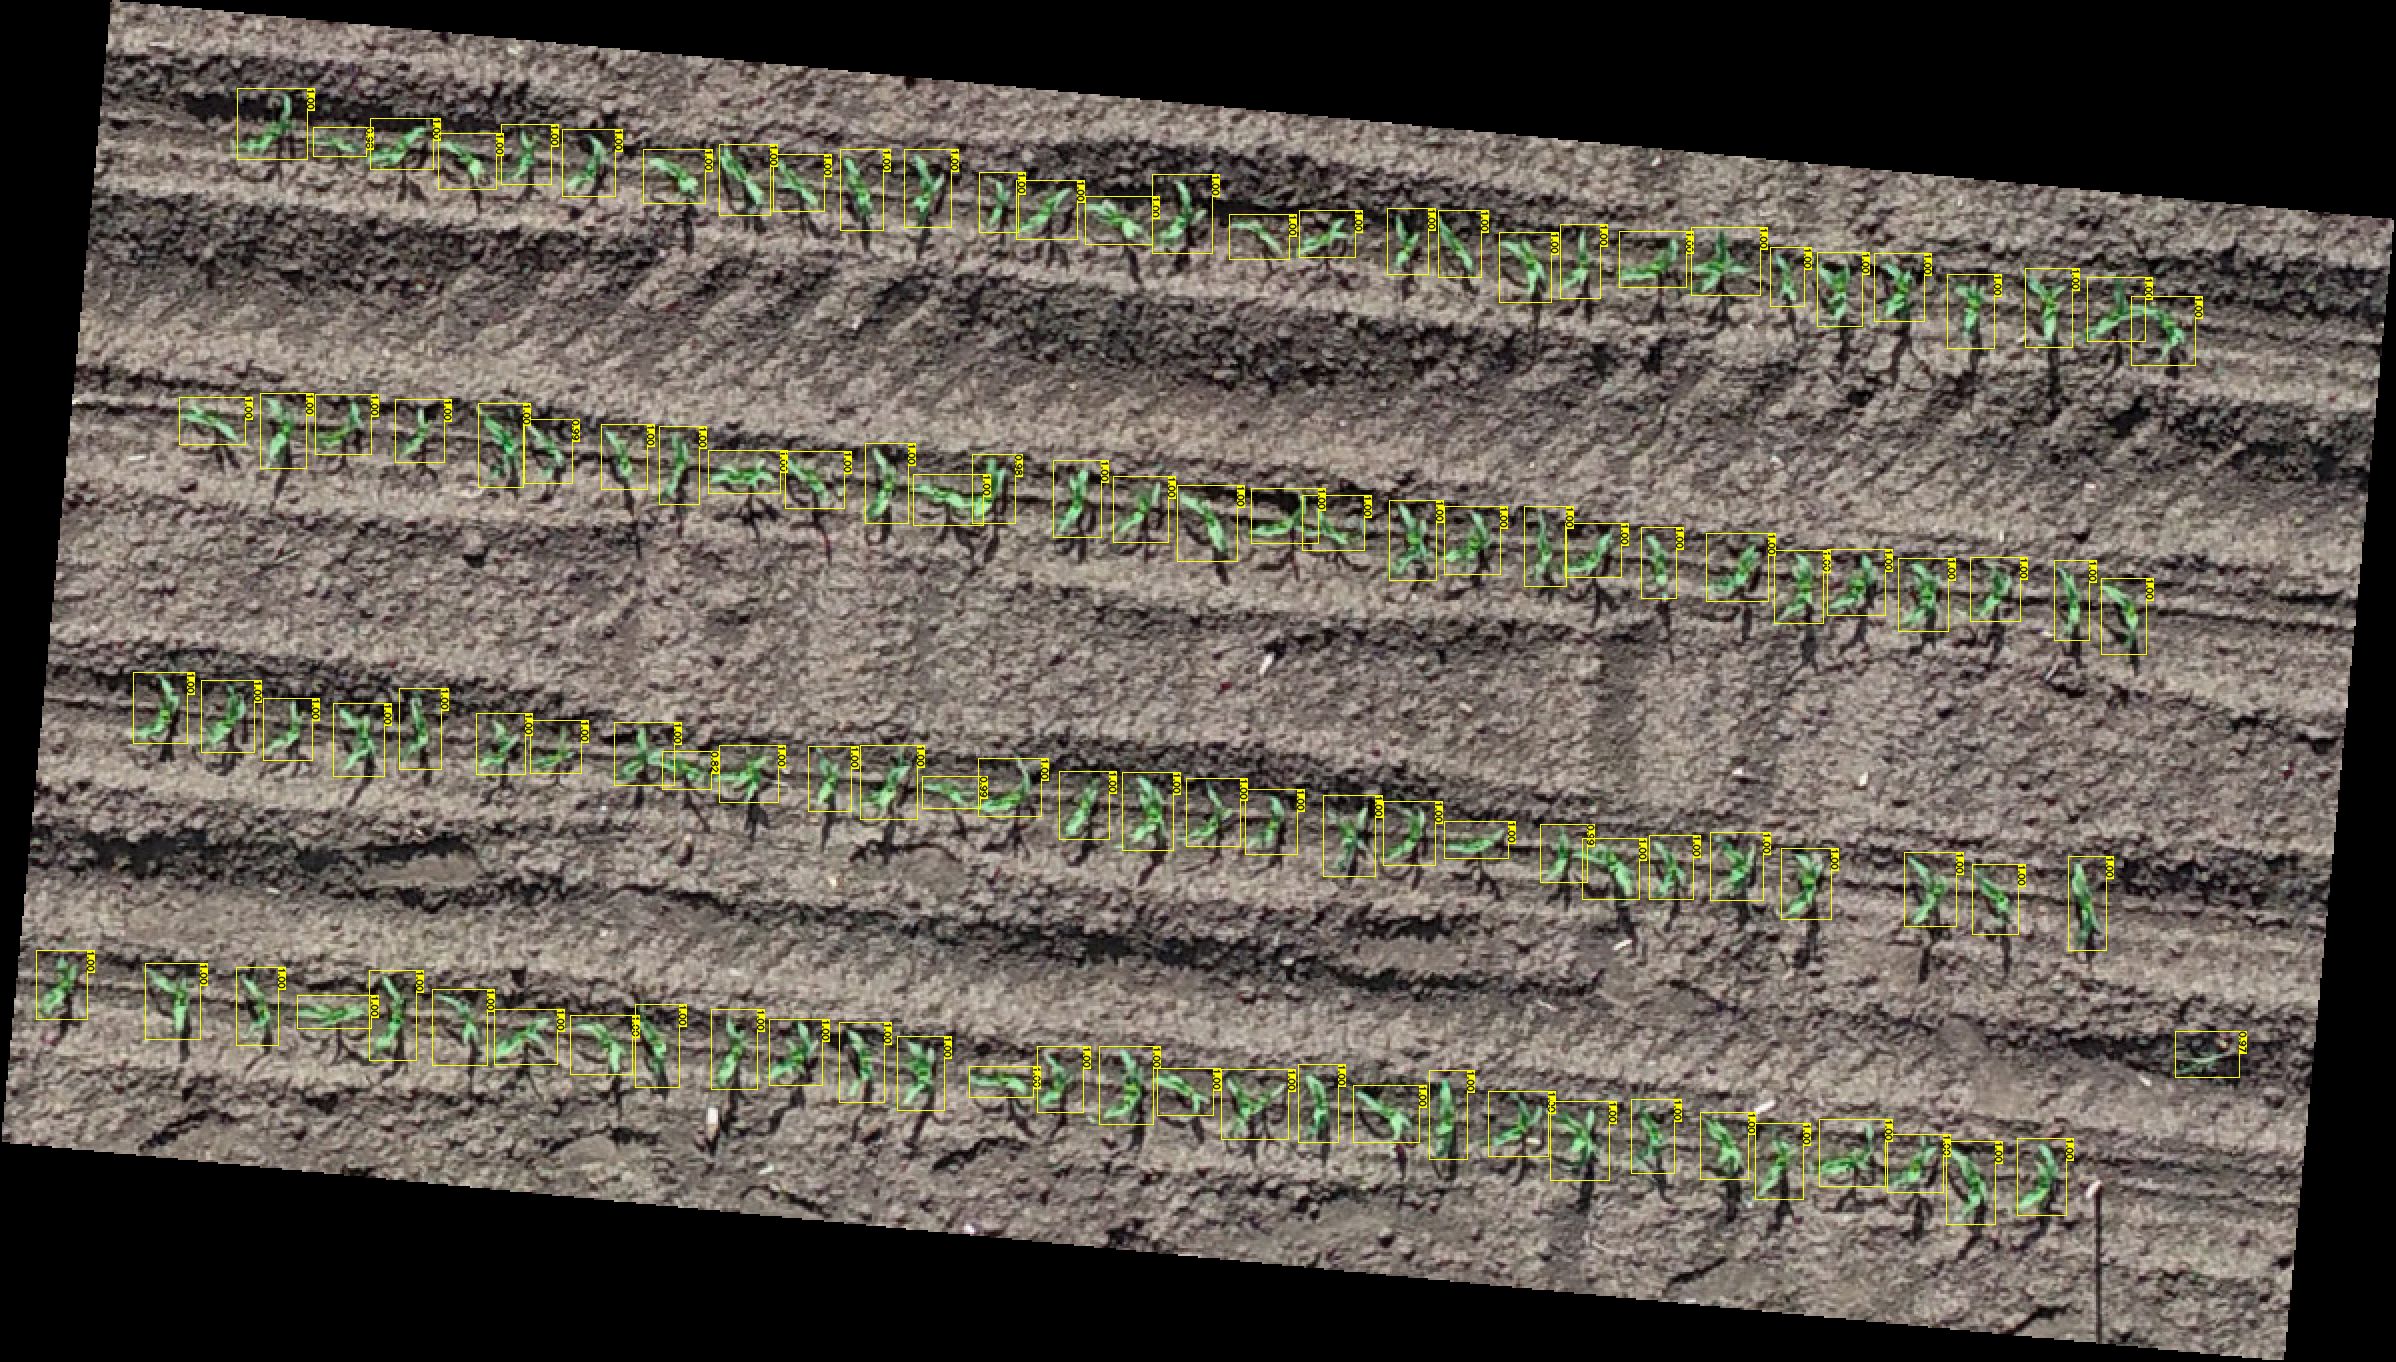
Around 2015, other companies such as Planet and ESA with the sentinel-2, came up with a totally different device approach: the satellite, but aiming at assessing field trials in the same way that drones did. Therefore, the drone industry had to adapt, that's the time were a common interest of the agricultural sector surfaced to use drones for smaller plant features inspections, at trial level, such as the canopy coverage (Fcover) and the plant count, for a few crops. Here is an example of drone phenotyping on maize:
Following the popular demand, the KPIs of interest became the image resolution and the flight configuration, meaning that quadcopter drones became the go-to devices, with their good-resolution embedded sensors and their improved maneuverability. Below you can find a picture of one of the first quadcopter drone phenotyping device to date. And as we like to call them at Hiphen, these devices can be categorized as the "DYI drones" because of their exposed wires and modeling-like esthetic.
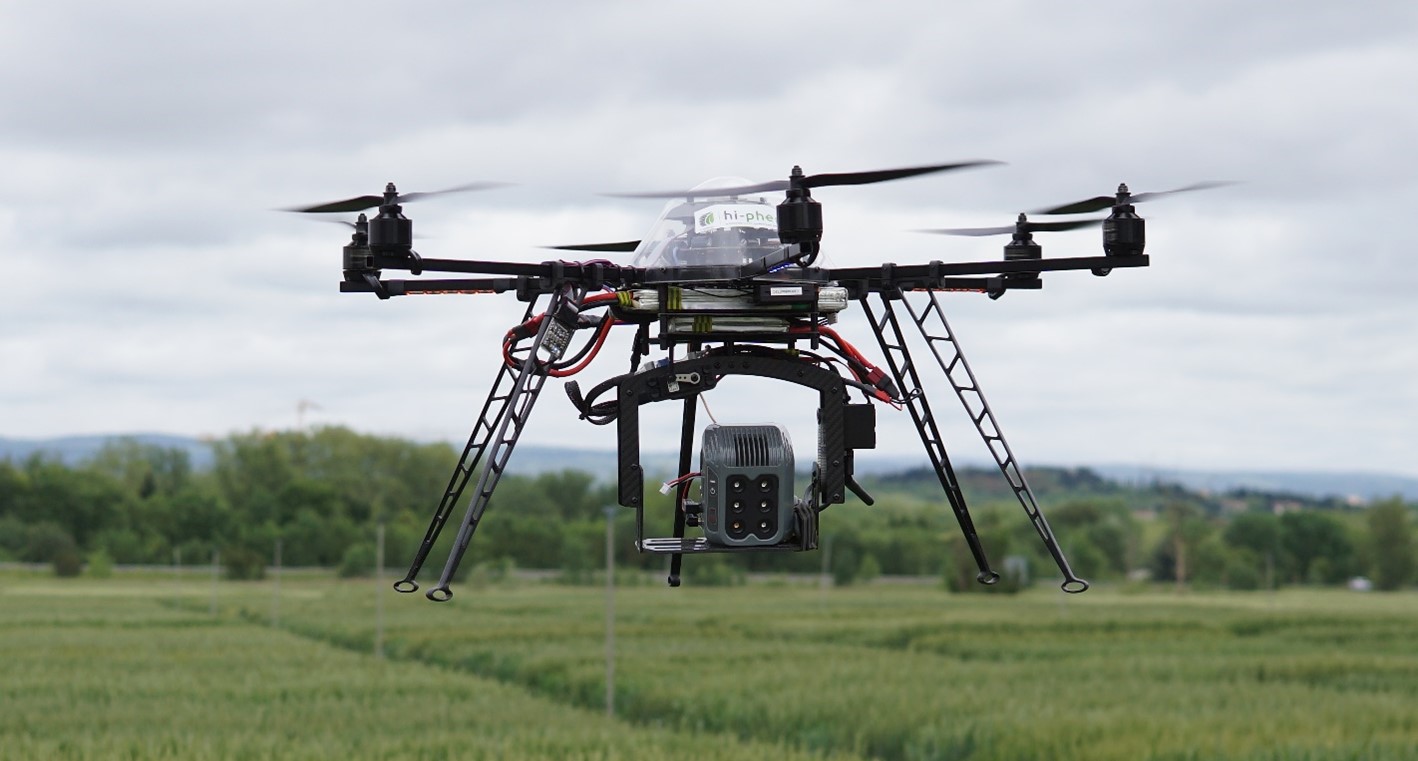
But the main drawback with the introduction of such "handmade" devices was the price point and also, they were not so easy to use. This new technology has for consequence a high price sensibility that made it sometimes not accessible to everybody's means. So, time was needed to widen access to this kind of equipment, and that's the time when DJI came out in 2018.
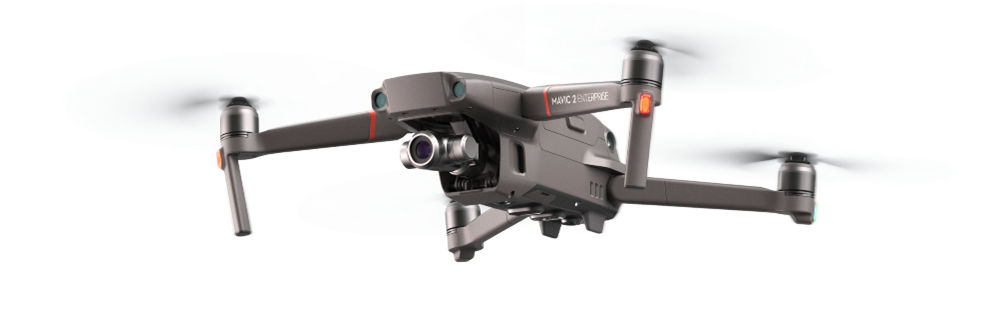
With the Mavic range (see the Mavic 2 Enterprise above), DJI brought a revolution to the market. Portable devices with embedded sensor that can be flown easily using a tablet or a small remote controller, that was clearly a game changer. Thus, more people started to being interested by drone phenotyping and to use them in their trials so, ever since at Hiphen, we have been working on drone data pipelines to develop new traits and to help you to uncover new plant features assessments remotely.
Then In 2020, we can say that drone phenotyping became more accessible with more offerings and more competition from companies such as Autel at least, which implied price drops for this kind of technology. From there, more and more people started to use drones in their field trials on a daily basis, that was the time of drone usage democratization. In addition to that, Artificial Intelligence (AI) is really reaching maturity now and we start to identify new possibilities for plant phenotyping with drones. So, on the one hand drones are now used by more and more crop researchers to collect data upon their crops' behavior, and on the other hand, new use cases are emerging since the technology is still improving. To bring answers to these new use cases, sensors providers such as DJI, SONY and PhaseOne have recently brought to the market high-resolution cameras that allow to give another dimension to drone flights. We are now able to assess more traits than never before, within one single image, thanks to the P3, P1 and L1 (LiDAR) sensors.
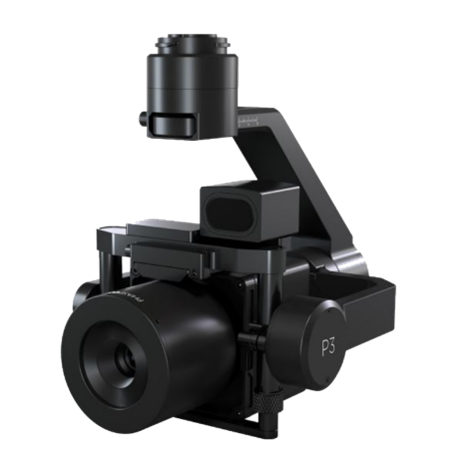


Is it worth the investment though? Well, it depends on the traits that you want to assess and on your budget obviously.
Therefore, at Hiphen we now envision to focus on making large scale assessments of simple plant features such as plot quality, plant lodging, plant count, early vigor and so on, with low-costs drone equipment because we now have well-vetted data pipelines for these devices and sensors. By low-costs drone equipment we don't mean cheap, but affordable such as the DJI Mavic 2 and its competitors because now they represent a great value for price. This kind of equipment is perfect to assess simple plant features at scale because the traits require standard resolution, and the embedded sensor of these drones are suitable to get the job done.
In addition, we are starting to scale up complex plant features assessments, which necessitate more image resolution, such as yield estimation, organ counting and diseases detection at least, using higher-resolution drone equipment. Here is wheat head counting for instance:
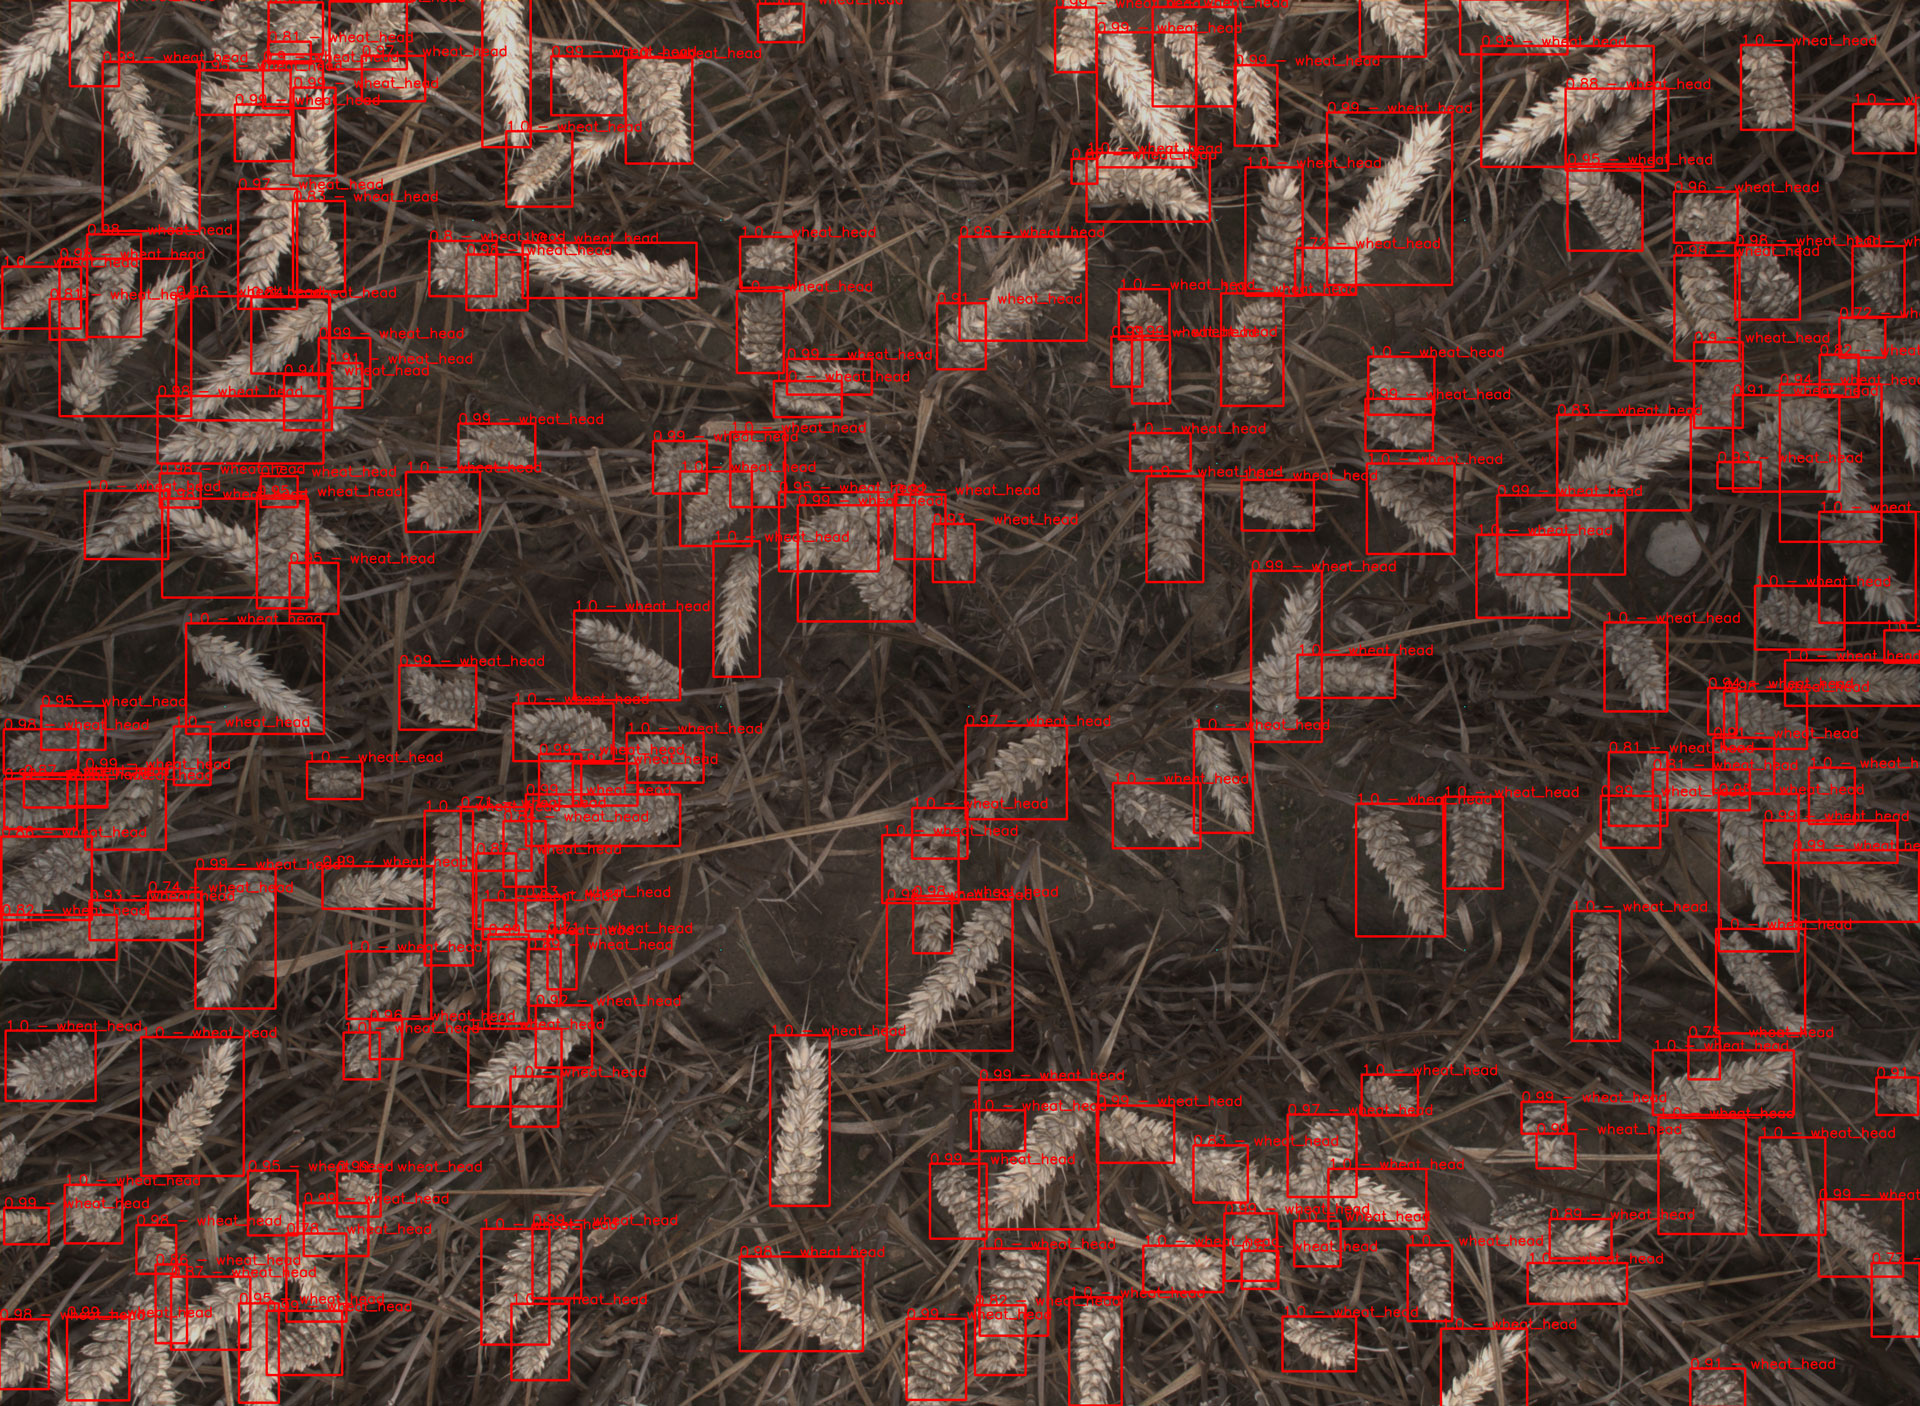
However, exactly as it did in 2015 with quadcopter drones, these new high-resolution drones and sensors are quite expensive while entering the market. As it stands for now, we really think that they are suitable if you have a precise and urgent need of this kind of equipment for current phenotyping projects, otherwise, our data pipelines are on point to assess routinely a lot of agronomic traits from our portfolio to help you to add valuable phenotypic data to your research programs.
To conclude, drones are now reaching maturity for plant phenotyping purposes. Indeed, a lot of devices and sensors can help you to answer your needs whatever your budget is. Stay connected to discover our drone equipment comparative table coming soon!
Meanwhile, don't forget that the right sensor for your projects should adapt to the requirements of the traits you want to compute and not the other way around. You can find some examples in the table below:
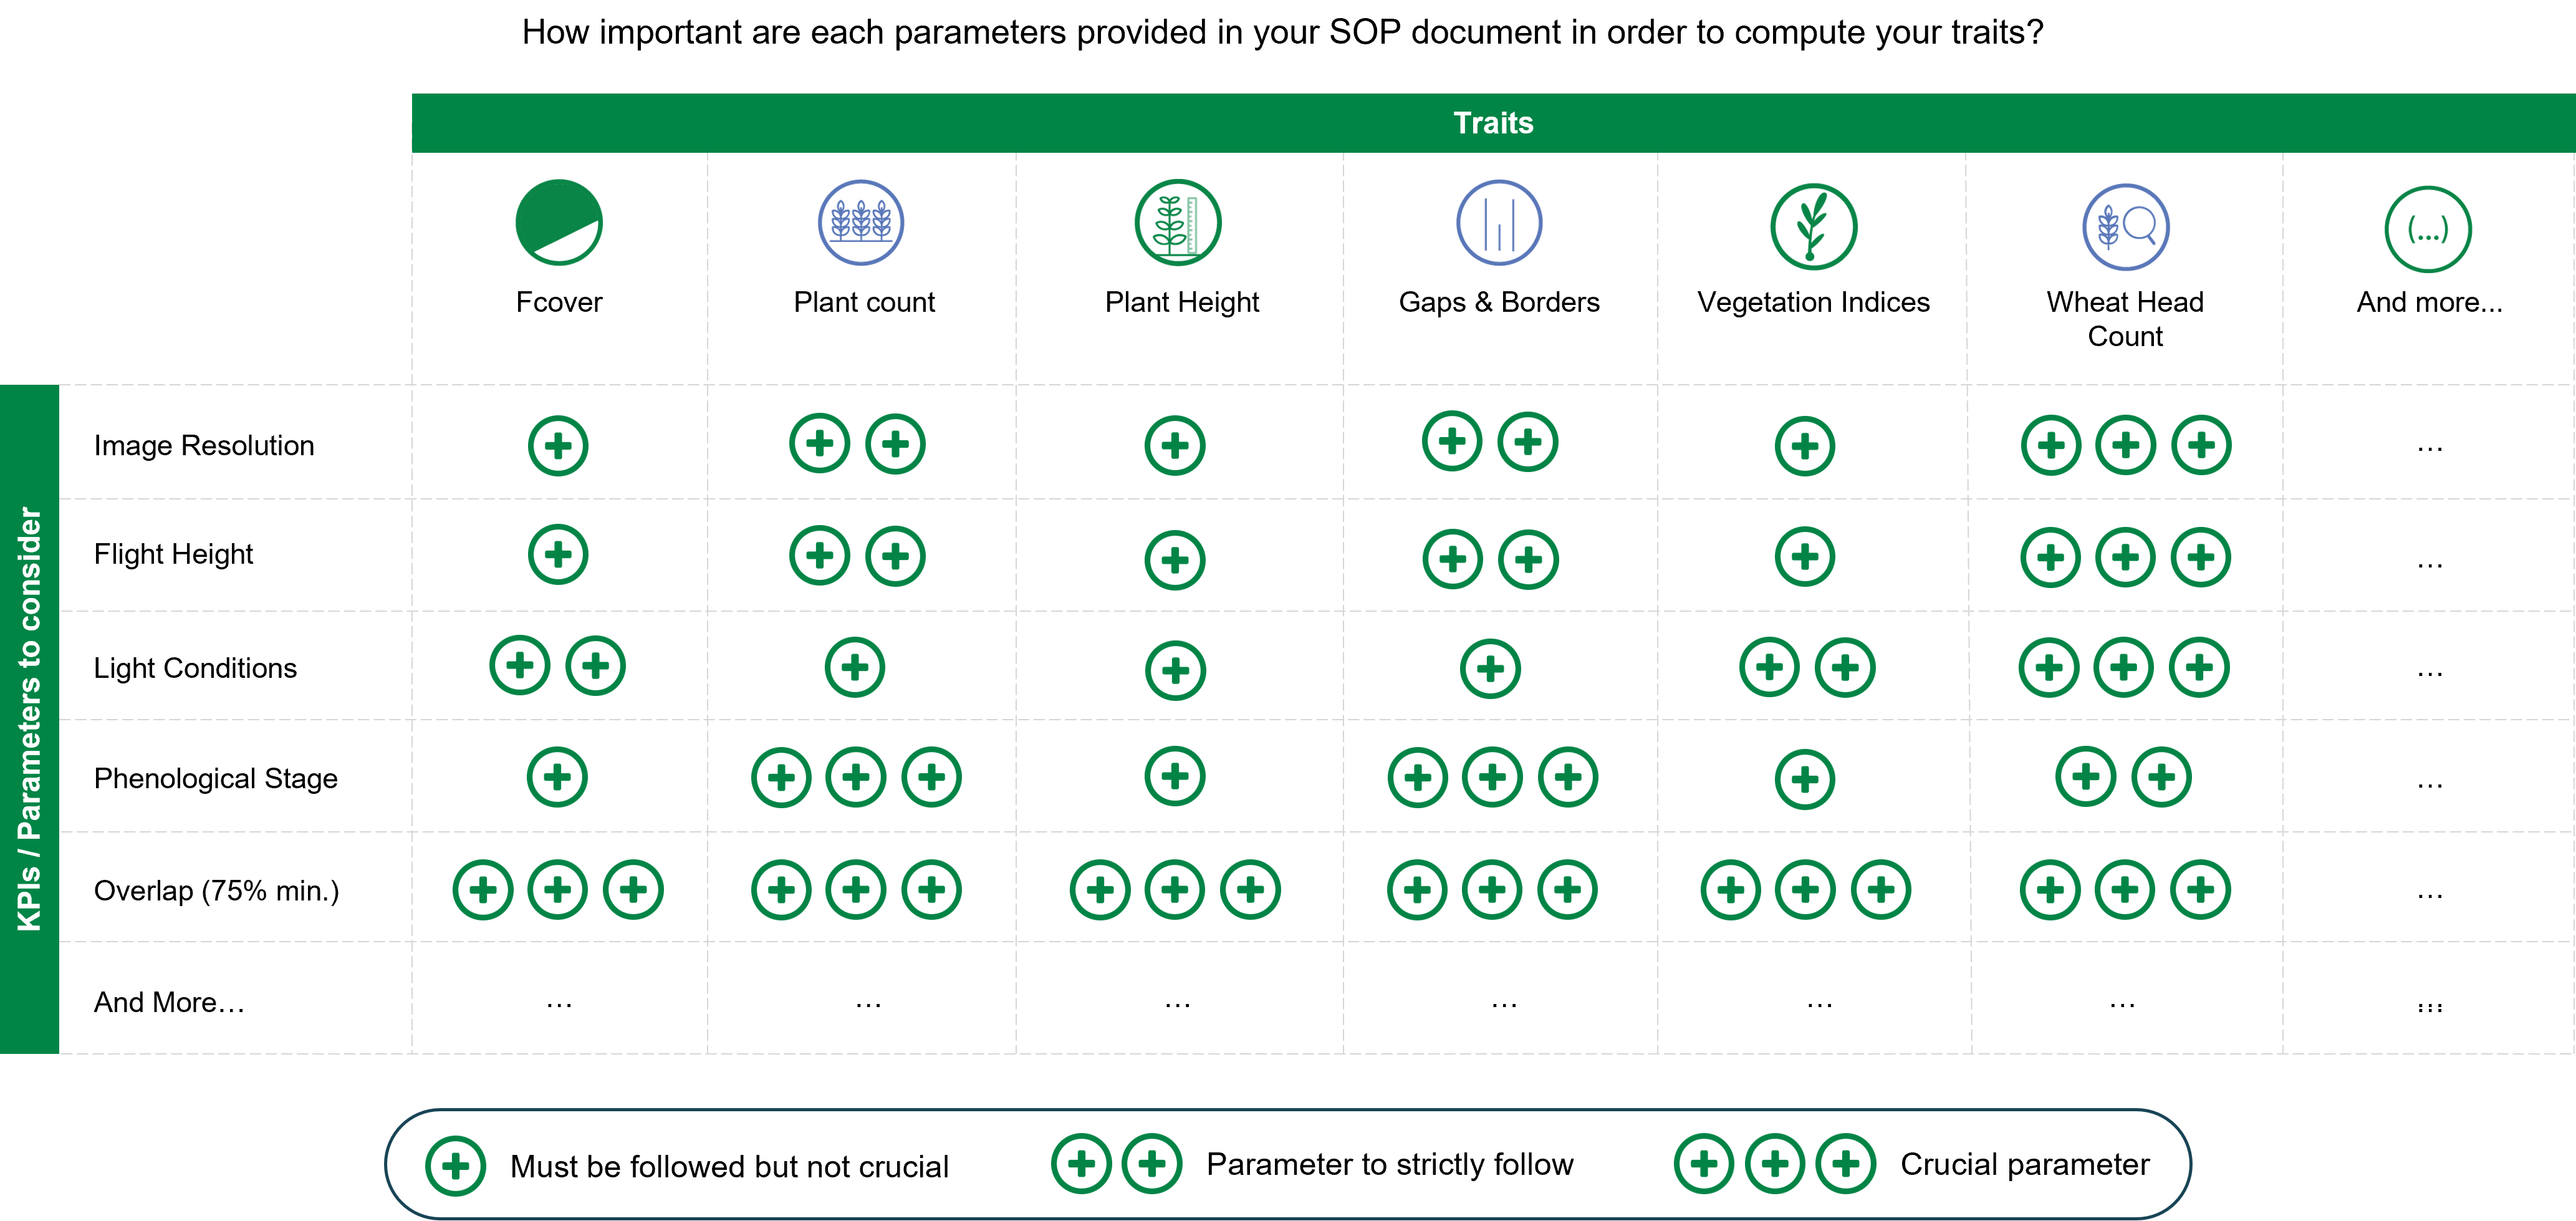
At Hiphen, we always give our best to extract maximum value from your field trial datasets to help you answer your phenotyping ambitions with quality-focused data. Thus, we are here to accompany you in your phenotyping journey from helping you to select the best-fitting device all the way through to providing you with the best recommendation and flight procedures, for a fast and accurate data processing of your selected traits.
Feel free to contact us should you have any question through our contact page. We look forward to hearing from you.
Speak soon,
Your Hiphen team.
At Hiphen, we accompany our clients towards each step of their plant phenotyping journey with the goal to provide a hassle-free experience and to deliver excellence in data quality. Drone data acquisition is often the starting point of your phenotyping project, and if not executed correctly, your agronomist team is likely to receive poor quality results. The Hiphen Academy is all about limiting this risk.
Like most of the agro-companies we serve around the world, you are looking at internalizing field data acquisition, which means training your own crew to fly drones across your field trials. We believe that it is the best way for you to reach a viable scale vs. economic balance, but in this process clients have to consider the following 5 criteria:
Well, the Hiphen Academy is your very own e-learning platform that has been developed to provide answers to these questions. It contains all the in-depth knowledge we gathered over the past 7 years of in-field missions worldwide, which took us almost 2 years to package cleverly in a user-friendly online learning platform.
When we started designing this resource, we quickly realized that it was important to emphasize that it is not aimed at teaching how to fly a drone – drone is easy, anyone can operate a drone these days – but rather at explaining how to fly a drone for agriculture!
Many times in the past we ended up exchanging with clients who had just outsourced drone acquisition to an external provider, expecting this partner to expertly deliver good data. However, some clients had bad experiences since the drone pilots did not have a sound understanding or sensitivity about the parameters and protocols they should be using to measure plant features. Drone flights should not all be treated as equals if you are interested in computing wheat head density than if you want to assess plant height or vegetation indices – which are traits that can be achieved with less-demanding KPIs.
The Hiphen Academy contains 6 courses and 45 lessons dedicated to drone plant phenotyping, representing 8+ hours of training, all based on real-life experience. You can consume this premium content at your own pace to kick things off, but the story doesn't stop here. It is invaluable to also provide you with the ability to ask questions to our team of experts and to receive their feedback on your very own data acquisitions to guide you all the way through until you become fully autonomous.
The Hiphen Academy is the first and the only one e-learning platform of its kind dedicated to crop researchers from plant breeding or crop protection companies around the world, who want to get the most of their field experiments data. The following video will introduce you to this intuitive and user-friendly e-learning platform:
As Alexandra explained in this video, the Hiphen Academy is composed of 6 courses that cover in detail all the know-how required before, during and after the drone flight. This knowledge is accessible via a single e-learning platform built to let you learn flawlessly and at your own pace.

A full demo of the Hiphen Academy has been made in a previous webinar. You can watch the replay HERE
Feel free to get in touch should you have any questions via academy@hiphen-plant.com
Your Hiphen Team.
Based on a quick survey conducted on social medias recently, the vast majority of agtech professionals (72%) think that drone is today the most versatile and easy to use device for plant phenotyping. It is true that, the latest improvements in drone technology makes this type of systems more performant and more accessible than ever. Thus, most of the crop researchers we work with around the globe are internalizing drone data acquisitions to make high-throughput plant phenotyping part of their plant assessment routine.
With modern technology, flying a drone is easy. Almost anyone can now get their hands on affordable equipment that you can familiarize yourself with fairly quickly to take-off and land by the press of a few buttons on a tablet. Once data is acquired, Hiphen then provides a hassle-free experience in the sense that all you have to do is upload your data on our cloud platform and then download your results – all the heavy lifting machinery in between is our responsibility. What one gets in return from drone acquisitions is an extensive list of valuable agronomic traits that accurately and objectively describe and assess plant architecture, behavior and sanitary state. You can consult our drone phenotyping catalog for more information about the traits that can be computed.
Equipment from manufacturers such as DJI are reliable for plant phenotyping, and ensure a frictionless experience with more and more automation and fewer interactions between the pilot and the machine. That being said, while most agtech experts agree that flying a drone is easy, flying a drone for agriculture requires special knowledge about the appropriate sensor choices and configuration, flight parameters and protocol to ensure that you acquire top-quality data.
The most common mistake is to acquire images with insufficient resolution. The compromise between speed and resolution (i.e. the number of pixels per ground cm) is critical and choosing inappropriate sensors and altitudes can result in poor data quality. Depending on the traits you are interested in analyzing, these parameters have to be carefully specified in advance.
Front and side overlap ratios ensure that each of your trial plots will be photographed multiple times to be able to generate an accurate field map – often referred to as an orthomosaic in our photogrammetry jargon. Setting the wrong overlapping parameters is very likely to result in data gaps in parts of your field trials.
GCPs are targets placed on the ground that have to be geo-referenced and hooked so they remain in the same precise spot during all the flights of the campaign. Not using this common practice is likely to result in inaccurate field maps which will make time series analysis almost impossible.
You are measuring plants, and plants are living organisms. Depending on your crop, genotypes, experiment, and the traits that have to be measured, it is important to acquire top-quality data at the appropriate phenological stage. In parallel, certain weather conditions have to be carefully anticipated to avoid blurry, overexposed or underexposed images, or even multispectral image processing being negatively impacted by wet field conditions.
As mentioned above, the choice of sensor is critical to deliver the appropriate image resolution, along with the orientation angle of the camera. Setting the wrong sensor parameters and not orientating your camera at NADIR is likely to negatively impact the quality of your drone data.
At Hiphen, we are present at every step of your plant phenotyping journey, starting with data acquisition, then data processing and data analytics to serve your applications such as best cultivar selection, yield prediction, ideotype qualification, trial quality assessment, cultivar risk assessment, and so on.
Thus we accompany you with your data acquisition by providing you with a drone acquisition protocol document that lists all the flight parameters and guidelines your crew should follow to ensure data acquired is high quality and consistent from one pilot to the other. In addition, we are delighted to announce the launch of the Hiphen Academy this fall. The Hiphen Academy is the first e-learning platform of its kind, fully dedicated to crop researchers focused on drone plant phenotyping projects. This online resource contains 6 courses and 45 lessons dedicated to drone plant phenotyping, representing 8+ hours of training, all based on real-life experience. Here is a quick video to introduce you to the Hiphen Academy.
👇 Watch the replay of our Webinar about the Hiphen Academy 👇
You can also register HERE to grab the latest news about the Hiphen Academy.
So stay tuned by visiting our website and LinkedIn page to receive the latest news about Hiphen and understand how we can help you to achieve your plant phenotyping goals.
Your Hiphen Team.
Join the agtech community set to improve wheat cultivar breeding selection – the plant phenotyping Empire needs you!
In the last round of online knowledge sharing sessions we organised for you during the April 2020 global lockdown period, we insisted on 3 key messages:
1: Hiphen is an expert in turning the latest scientific advancements in operational solutions for our clients. This is the reason why we care deeply about introducing bullet proof solutions that can work across different field conditions. We do not want to change the data processing engine everytime we jump on a different journey;
2: We care about being transparent with you so that you understand the methodology we use and you can engage with it to customize it to your needs. With all the knowledge shared last April, we do hope that this message came across – please please please, work with a plant phenotyping partner from whom you understand the methodology, do not opt for a 'black box' approach and feeling, you will not far with that;
3: We care about being agile to allow you to scale. We believe that there is little vamue in investing in a method that will only work on a specific domain and that you cannot deploy to your regional, national or global footprint.
With the Global Wheat Challenge, here is a chance to develop an AI-powered solution that can deliver on all three missions. You can replay our webinar on this topic HERE to get more detailed information.
The Global Wheat Challenge is an international computer science competition to count wheat ears more effectively, using AI-powered image analysis. All the details about this kaggle competition can be found HERE. The competition will run from May 4th to August 4th 2020 and is made possible thanks to the collaboration of an International consortium of research institutions that compiled over 190 000 annotated images of wheat heads across 3 continents. A cash prize of 15 000 Dollars awaits the data science teams that will develop the best AI-powered wheat heads counting model.
Global WHEAT Dataset is the first large-scale dataset for wheat head detection from field optical images. It includes a very large range of cultivars from differents continents. Wheat is a staple crop grown all over the world and, consequently, interest in wheat phenotyping spans across the globe. Therefore, it is important that AI-powered models developed for wheat phenotyping, such as wheat head detection networks, can be applied across different growing environments around the world.
Remember, the plant phenotyping Empire needs you!
Keep safe!
A Vegetation Index is a single value calculated by transforming the observations from multiple spectral bands. It is used to enhance the presence of green, vegetation features and thus help to distinguish them from the other objects present in the image. Depending on the transformation method and the spectral bands used, different aspects pertaining to the vegetation cover in the image could be evaluated say, the percentage of vegetation cover, amount of chlorophyll content, leaf area index and so on.
All the ratio indexes, in general, are independent of the illumination conditions at the time of acquisition and slope effects.
This is the simplest VI which is a ratio between the reflectance recorded in the Near Infra-Red (NIR) and Red bands. This is a quick way to distinguish green leaves from other objects in the scene and estimate the relative biomass present in the image. Also, this value may be very useful in distinguishing stressed vegetation from non-stressed areas.
Simple Ratio = ρNIR / ρRed = ρ850 / ρ675
According to the spectral signature of green leaves, they exhibit very low reflectance in the Red and Blue regions (leaves reflect more in the green region and hence appear green). However, the reflectance is relatively higher in the NIR region. Thus, the SR value is close to 1 when the object has similar reflectance in both Red and NIR bands – for example, soil. Whereas, for a green object the value would be much greater than 1.

This is one of the most commonly used method for monitoring the percentage of green cover in an area. Since it is a ratio, this index is invariant to the difference in illumination conditions, slope, seasons, etc. and thus suitable for crop monitoring throughout the growth season. It is calculated by taking a ratio between the difference of reflectance from NIR and Red bands and the sum of reflectance from NIR and Red bands.
NDVI = (ρNIR-ρRed) / (ρNIR+ρRed) = (ρ850-ρ675) / (ρ850+ρ675)

The Photochemical Reflectance Index is a measure of the light-use efficiency of foliage and thus is primarily used as an indicator of water stress and for the assessment of carbon-dioxide uptake by plants.
PRI = (ρ570-ρ530) / (ρ570+ρ530)
It is sensitive to the variations in the carotenoid pigments (for example, xanthophyll) in the leaves. These carotenoid pigments are involved in converting the absorbed photosynthetic radiation into fixed carbon.
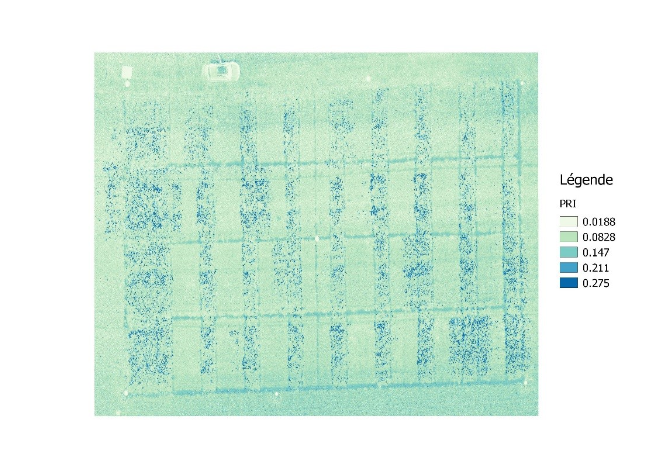
If you want to know more about vegetations indices, take a look at our article about Vegetation Indices on Chlorophyll Content !
In this second episode of our series of CAPTE videos, Alexis from Hiphen asks Professor Frédéric Baret from INRA EMMAH about high-throughput plant phenotyping and its importance for the agriculture ecosystem.
Professor Baret defines plant phenotyping as the science of the characterization of the crops which is particularly important for decision support in agriculture and for plant breeders when selecting the best genotypes that will become the future cultivars well-adapted to different environments. As such, plant phenotyping helps to better understand the functioning of the crops, and this type of informations is often used to calibrate crop models.
In the past, the classical method used for phenotyping was labour intensive as it required an army of experts in the field to score plant samples, record plant characteristics manually (e.g. plant height) and often to retrieve (and thus destruct) plant samples in order to run tests in labs. This approach was therefore limited by its throughput which impacted data accuracy and it limited the number of traits for the characteristics that we extract from the plants.
Nowadays, non-destructive high-throughput methods are used to characterize the plants allowing us to record in a couple of hours what used to take field experts months to collect. Data acquisition technology using UAV (drone), satellite, phenomobile, handheld devices and AI-based algorithms now allow experts to spend more time analysing the results and efficiently making decisions instead of spending most of their time on the ground manually measuring plants.
High-throughput plant phenotyping can be achieved at a very large scale indeed. Most of our clients tend to scan on a single date multiple fields and trials from different locations globally, sending us the data remotely the next day and getting traits and results back in a matter of hours or days. In that sense, plant phenotyping is revolutionary and we believe that any actors in the agriculture sector can benefit from it as a wide range of data acquisition equipment and methods exist at Hiphen to adapt to your needs, budget, crops and required traits.
If you would like to hear more about it or should you have any questions, do not hesitate to get in touch with us via email at contact@hiphen-plant.com or by phone at +33784143163. Lastly, feel free to visit our scientific papers archive should you seek more details about the methods and techniques we develop at CAPTE.
In this seventh episode of a series of CAPTE videos, Joss Gillet from Hiphen and Samuel Thomas from Arvalis talk about Cloverfield, our online data processing engine built to automate the processing of plant phenotyping datasets.
Samuel explains that our data platform is built on a secure cloud-based architecture running on Amazon Web Services and docker technology to efficiently assemble and trigger the various algorithms required to process specific agronomic traits for our clients.
This online tool can process data acquired from any sensors, such as UAV (drone), Phenomobile, satellite, IOT and handheld devices such as Literal. This type of data engine is critical for any agro-actors such as plant breeders, farmers and cooperatives that have large fields or microplot trials spread across vast regions across the world. For them, it is very costly to compute all the data acquired on their fields and trials, and results tend to take a long time to be delivered. In addition, it often limits the amount of data clients think they can acquire, and they tend to prioritize certain fields or trial experiments to the detriment of others because processing too much data was up to now almost impossible, too expensive or would have required to in-house technical skills that would have made the task daunting.
First of all, Cloverfield allow to collect crops images after the data acquisition. After that, the automated data processing starts to run thanks to our algorithms and deep learning techniques. Then once the processing is finished, the next step is data visualisation as you can browse the agronomic traits computed very intuitively on the field map.
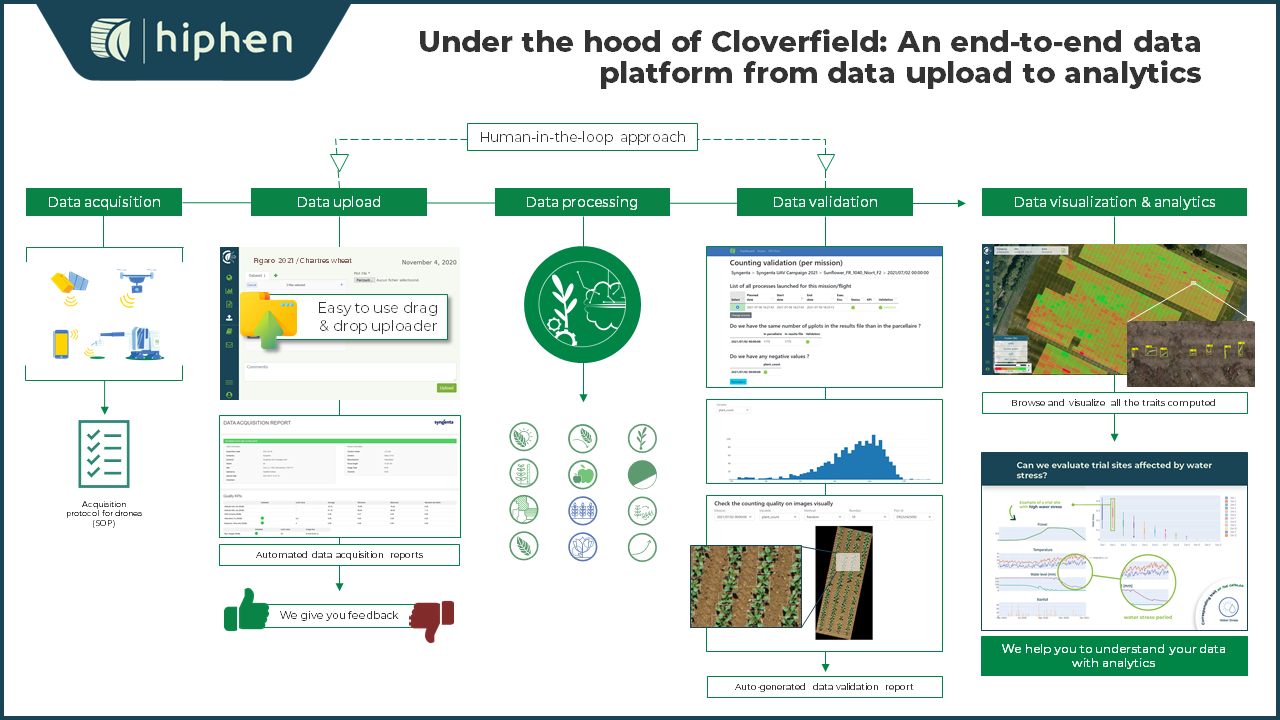
Under the hood of Cloverfield
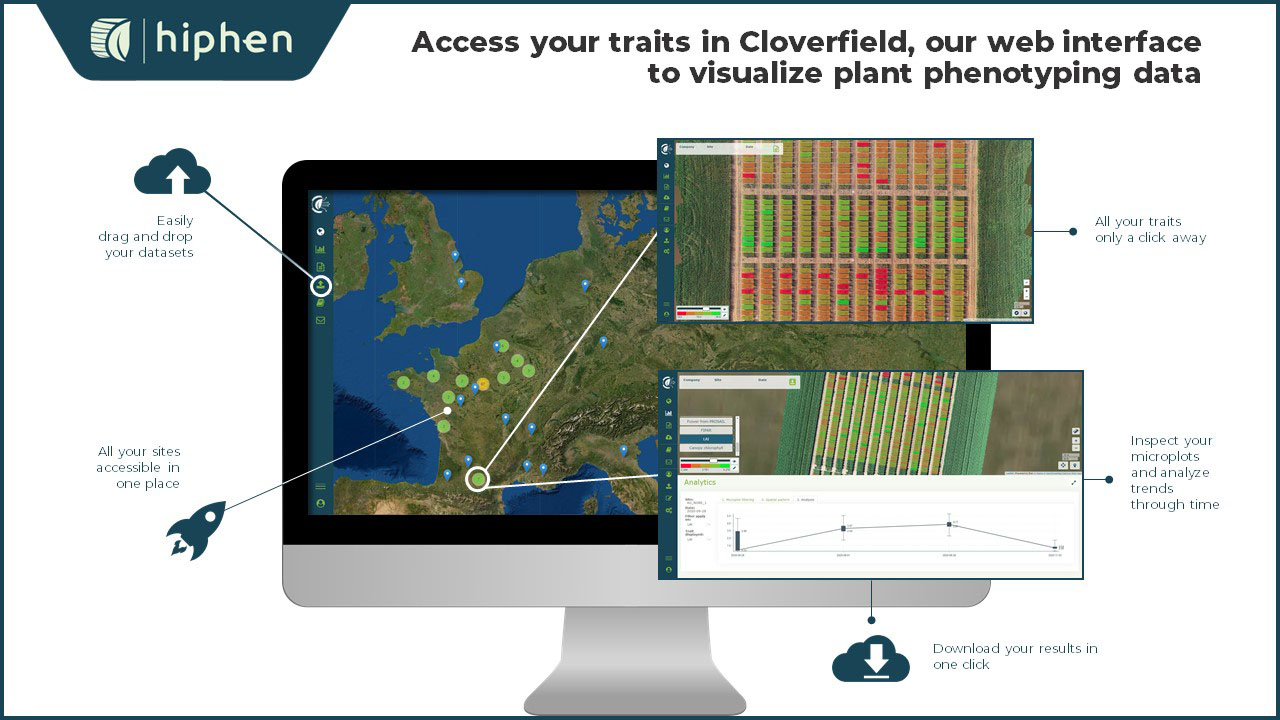
Cloverfield user interface
Cloverfield removes all these barriers and brings a new dimension to the plant measurements and phenotyping ecosystem, allowing users to concentrate on acquiring data, knowing that with our solution we can process large volume of data in a matter of days. The tool is flexible enough to accomodate for the specific agronomic traits selected by the client, but it can also deliver direct or intermediary outputs such as raw images, co-registered images, orthomosaics, microplot extractions, etc.
We use Cloverfield to deliver global contracts for our clients, ranging from plant breeders to agro-industrial actors with an international footprint. For instance, we receive UAV data all year long from countries in the Americas to Europe and Asia that Cloverfield can then process in a very timely manner.
Do not hesitate to get in touch with us should you wish to learn more about Cloverfield and how to gain access to it. We look forward to hearing from you.
In this fourth episode of a series of CAPTE videos, Alexis from Hiphen asks Professor Frédéric Baret from INRAE EMMAH to describe the type of plant phenotyping traits and indicators we can compute using UAV (drones). But first of all, if you don't know what an agronomic trait is, check out our dedicated post HERE.
Professor Baret explains that we can group these traits in three classes:
With the first class of traits, we are indeed measuring traits related to the canopy structure like the amount of leaves, or the amount of light intercepted by the crop that can then be transformed into biomass. With the second category of traits, we are aiming at characterizing the biochemical composition of the plants which is very interesting for instance for the chlorophyll content since it is closely related to the nitrogen intake of the plant.
Finally, disease symptoms and plant stress can indeed be measured with different methods in order to understand if the crop is growing under good conditions of if some stress factors are limiting its development such as water or thermal stresses.

At Hiphen we have developed a catalogue of traits based on methods that we continuously challenge and improve within the CAPTE research unit. We can therefore offer a robust set of high-value traits and indicators, while being very creative to compute new ones – either as technology evolves, or because our clients request very specific traits.
We would be delighted to tell you more about our traits catalogue, so do not hesitate to get in touch with at contact@hiphen-plant.com to ask questions and see how we could support your projects.
We look forward to hearing from you.
Keep safe,
Your Hiphen Team.
In this third episode of our series of CAPTE videos, Alexis from Hiphen asks Professor Frédédric Baret from INRA EMMAH to provide an overview of the remote sensing technology for plant phenotyping.
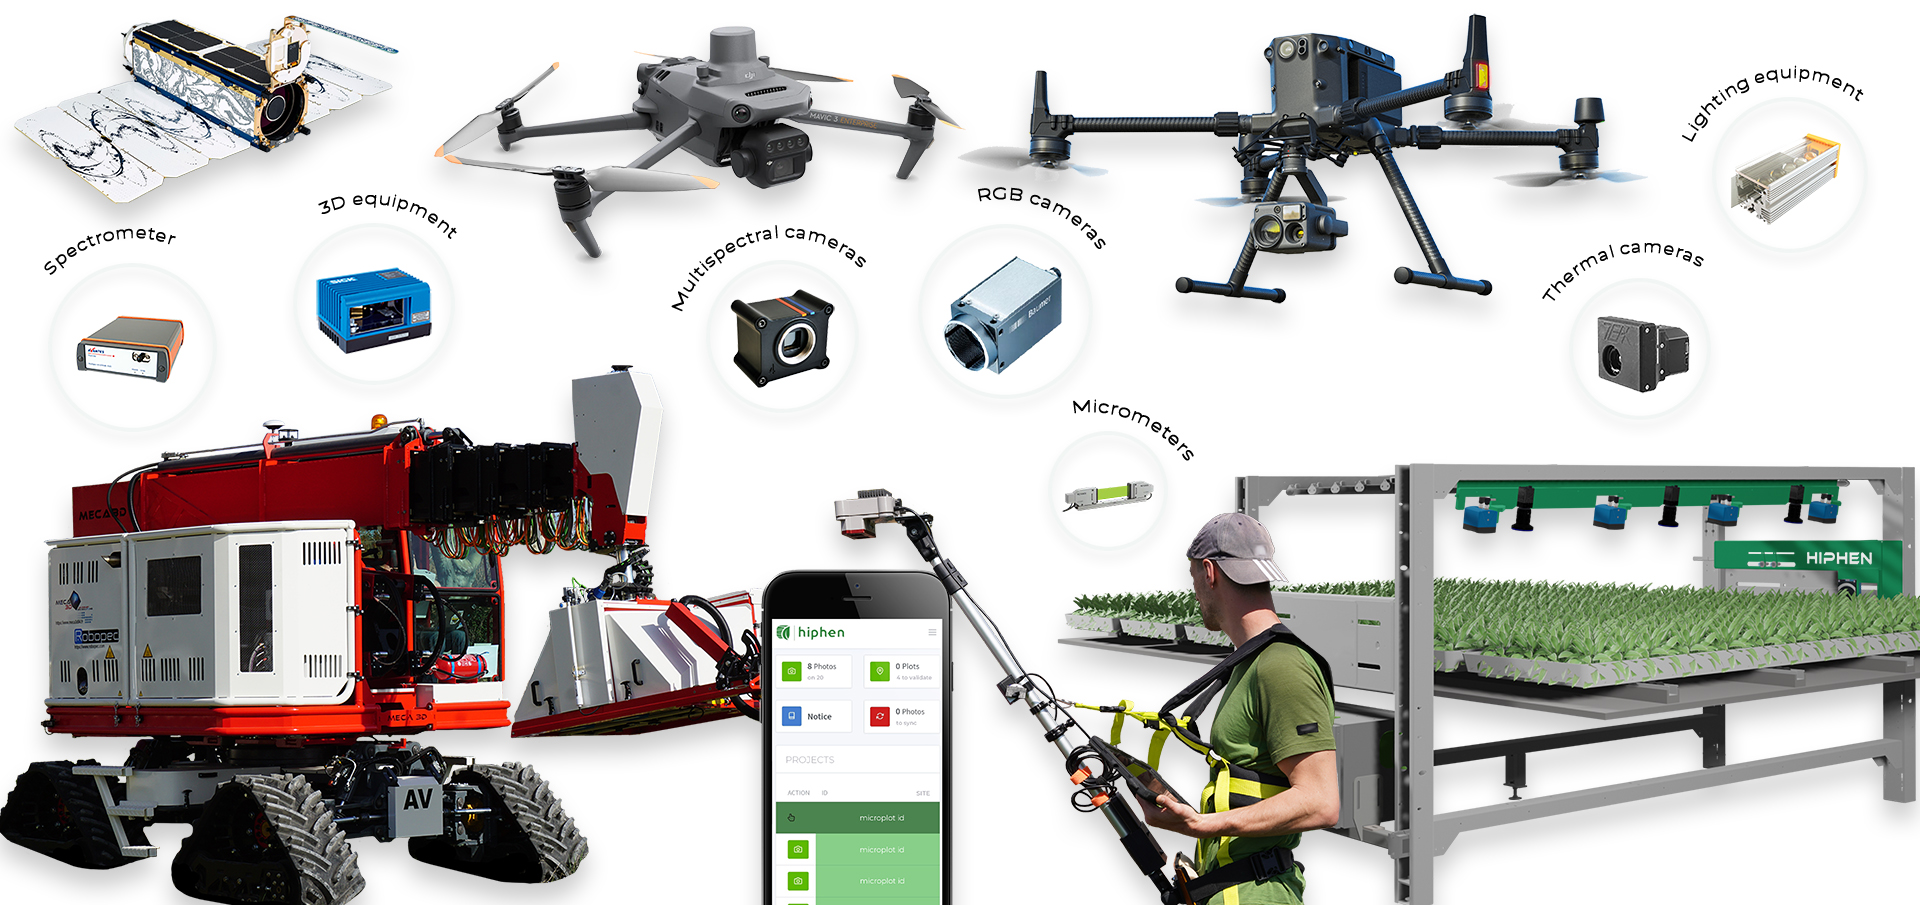
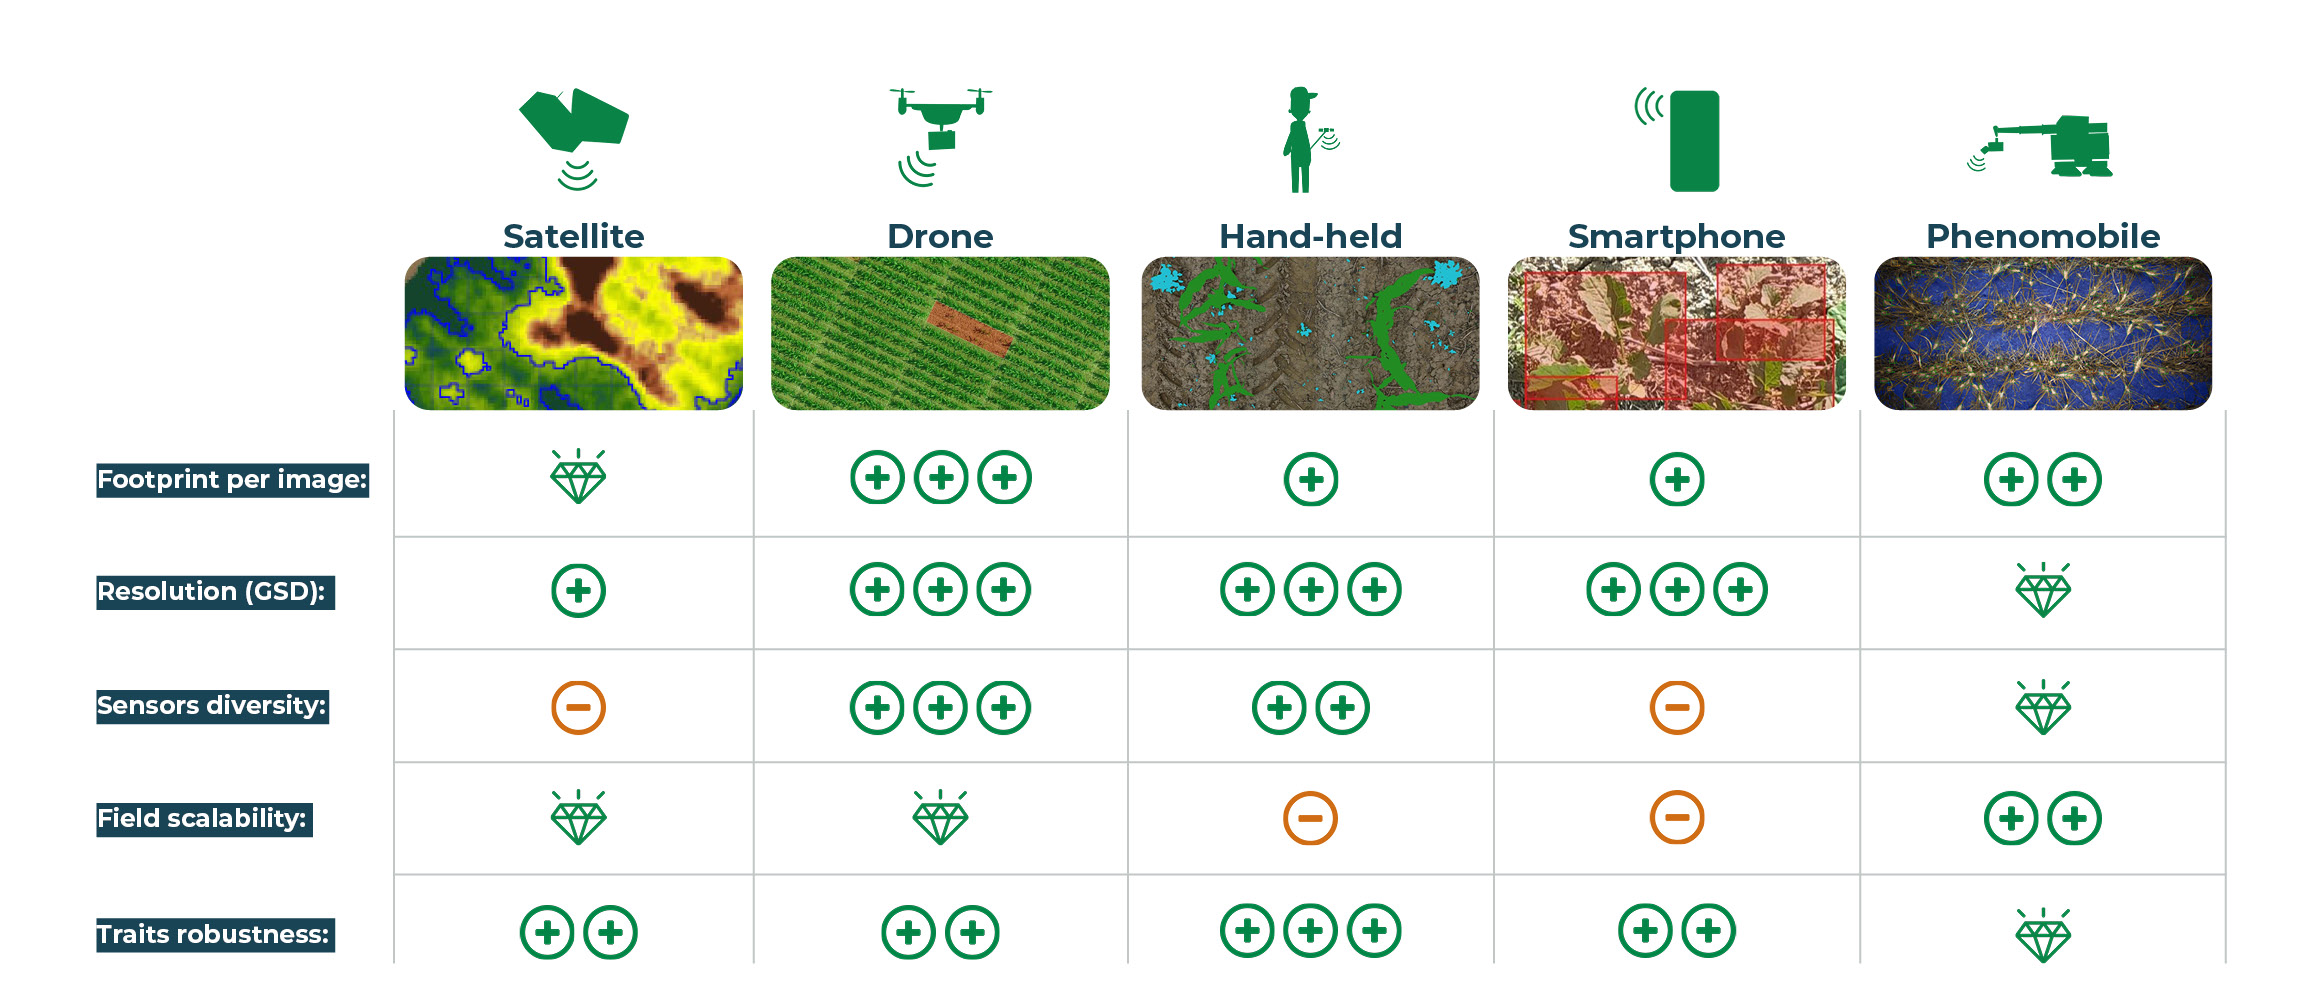
Professor Baret explains that there are different types of sensors that can be mounted on various vehicles, showing that there is not a one-size-fits-all solution but rather a range of technology suitable for different traits, applications, crops, budgets, etc.
Among the sensors presented in this episode, you will hear about the RGB or multipsectral cameras such as the Airphen camera developed by Hiphen and CAPTE members. These cameras present a range of advantages from high-resolution images that help to characterize the structure of the canopy, plant organs and detect diseases, all the way to assessing the biochemical composition of the plants – such as its chlorophyll content. LiDAR is also used to reconstruct in 3D the structure of the canopy in order to derive important traits such as plant height.
In parallel, these sensors can be mounted onto various vehicles from UAV (drones) to automated robots – called Phenomobile and handheld devices such as "Literal". As highlighted in this video, these vehicles present different strength and weaknesses. For instance, while UAV allows us to reach very high-throughput, the resolution it renders can vary from medium to high resolution. In contrast, a Phenomobile provides very high resolution and very accurate measurements, while being able to adapt to various environmental conditions thanks to its embedded flashes.
At Hiphen, our philosophy is that remote sensing technology for plant phenotyping has to be tailor made to your project. So, your application will require either one type of system, or a combinaison of sensors and vehicles. This really depends on your crop, the traits you are interested in, etc. That is why we always put forward our expertise in data fusion, and the range of technology, hardware and equipment that we offer our clients will continue to evolve as technology and methods keep improving.
Should you wish to learn more about our solutions can best support your business, please get in touch by email at contact@hiphen-plant.com. Lastly, feel free to consult our scientific papers archive that contains tones of information about phenotyping technology and methods we developed over the past years at CAPTE.
We look forward to hearing from you.
Sincerely,
Your Hiphen Team.