In this episode of a series of CAPTE videos, Alexis and Wenjuan from Hiphen discuss the value behind the fusion of satellite and IOT data.
Wenjuan notably explains that data fusion allows us to provide daily satellite imagery of the fields during the entire crop growing season. This is particularly important for farmers who want to monitor their fields in near real-time in order to best manage their crops – especially during key phenological stages.
Satellite imagery from Sentinel-2 is typically available every five days, unless clouds are present in which case you could have several weeks without data. This issue makes you 'data blind' during this period, which might be okay if you monitor a handful of fields located in the same region, but definitely not acceptable if you have to monitor hundreds of large fields spread across one (or more) country.
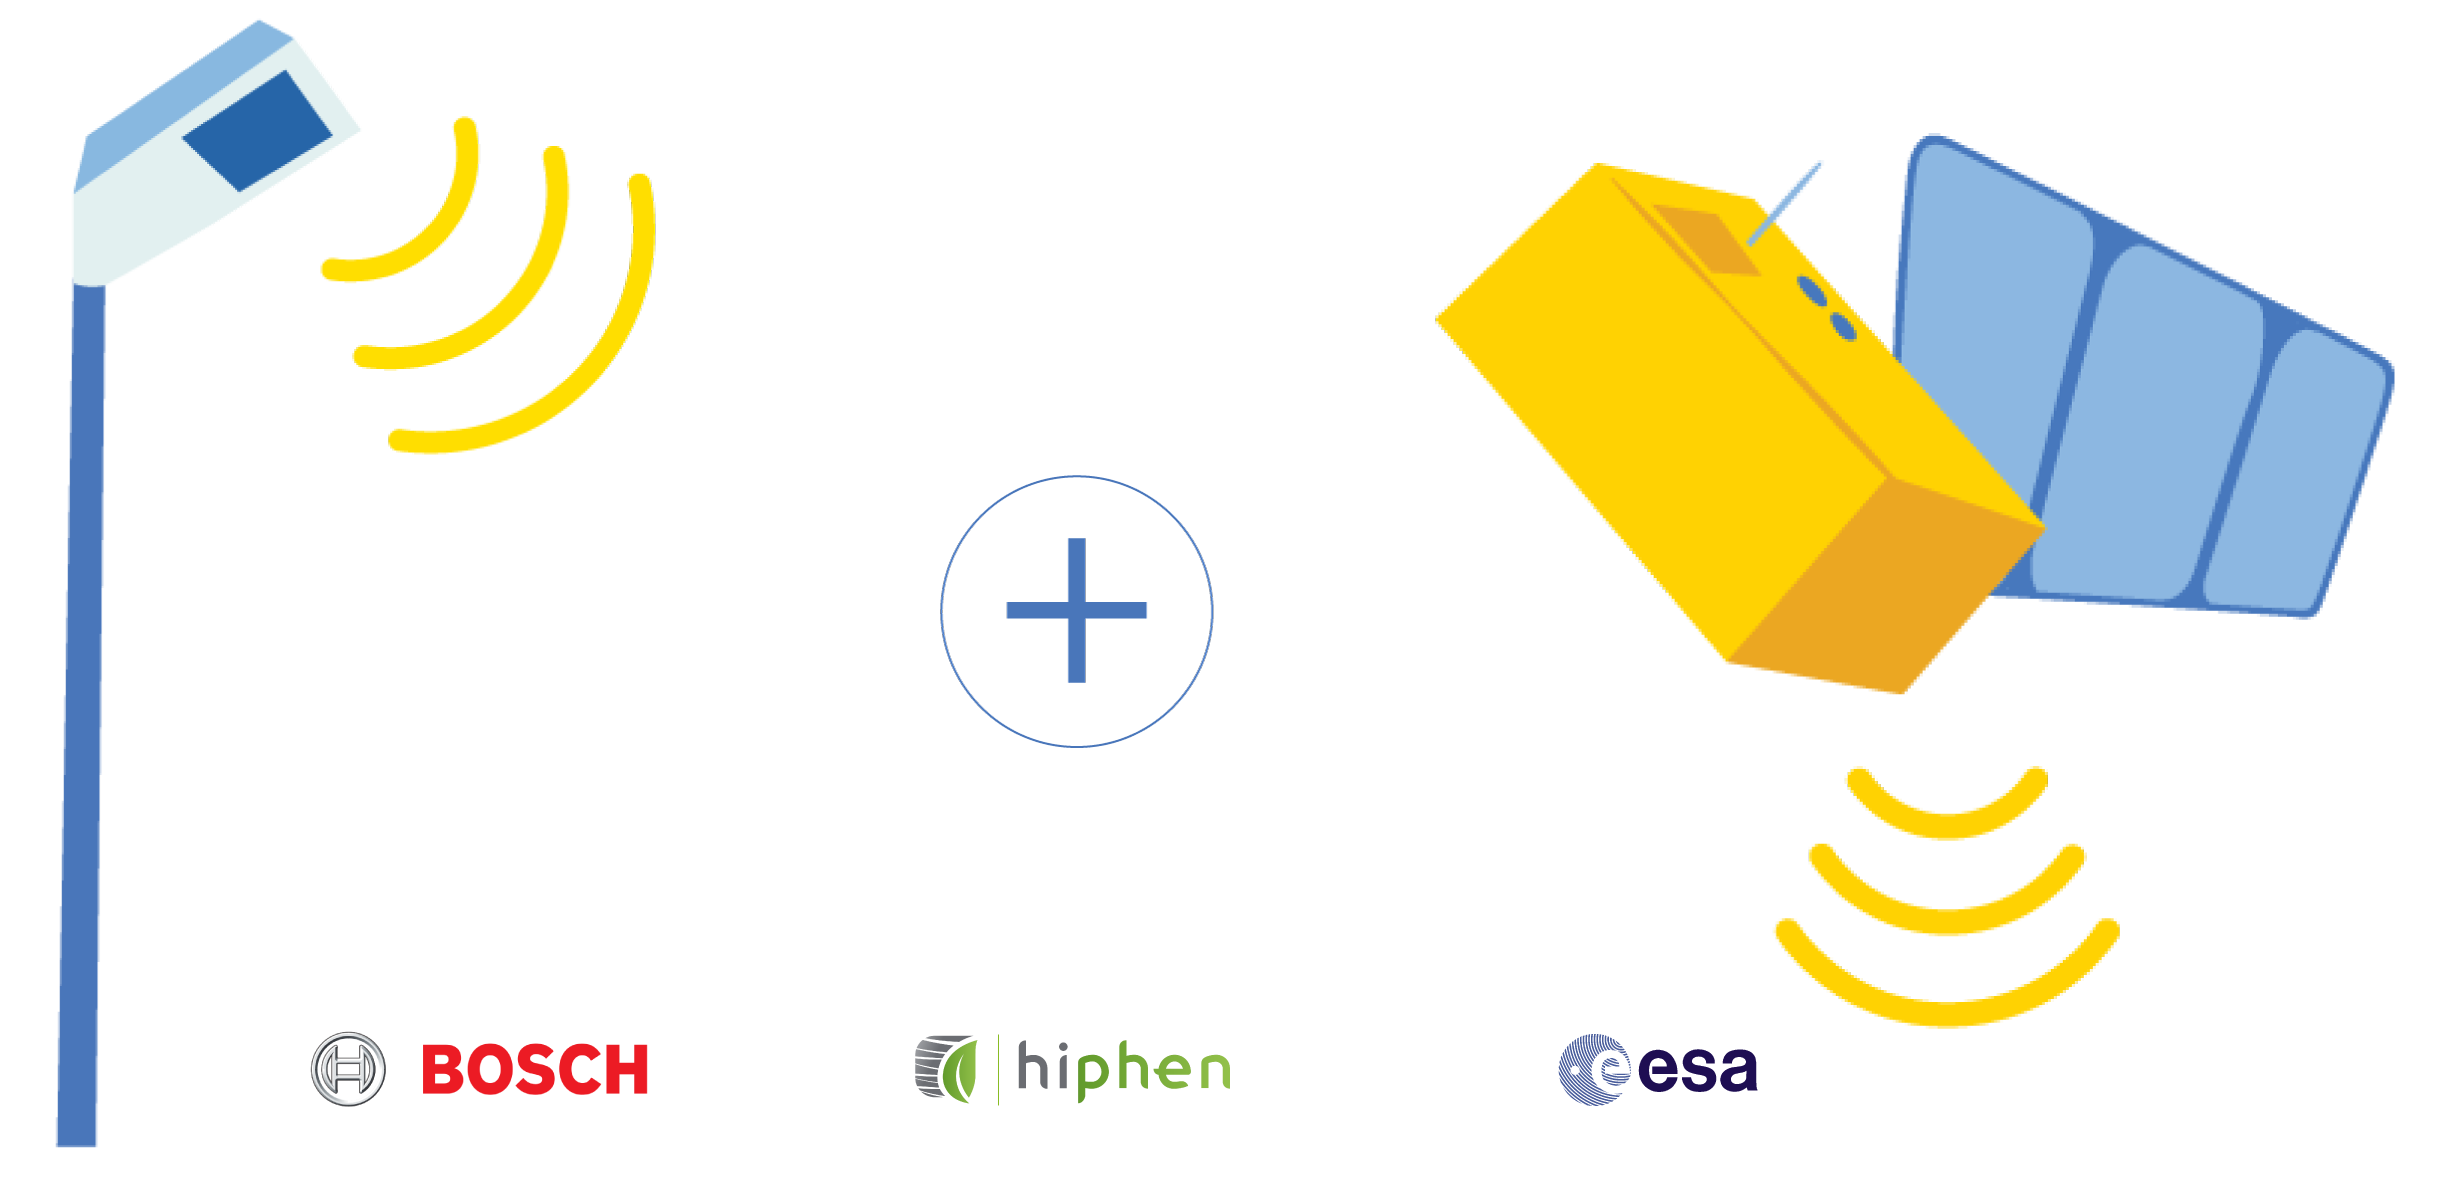
To fill in the data gaps for the periods where clouds made us 'data blind' we use IOT Field Sensors manufactured by Bosch in order to get a real-time eye in the field. The IOT sensors are placed in strategic stationary locations in the field (dependent on the pre-study of the field heterogeneity), and these IOT data inputs are extrapolated to be spatialized at the entire field level using satellite data. Thus, delivering a daily map of the fields.
Several biophysical indicators can be derived such as Leaf Area Index, NDVI (a proxy linked to the quantity of vegetation), CIgreen (a proxy of chlorophyll content) and others. The direct inputs from the satellite-IOT data fusion are then used for different applications ranging from crop management (fertilization, irrigation), yield assessments, and early warning systems inclusive of disease symptoms detection and phenologycal events detection.
As always, we would be delighted to tell you more about this type of solution and how they could potentially fit your agtech strategy. We look forward to hearing from you.
As consumers in many parts of the world are demanding a verifiable evidence of food traceability, actors across the agriculture sectors are looking for innovative solutions to build tools and mechanisms to reach greater transparency at all levels. At Hiphen, we believe that one way to potentially solve this challenge is by improving the link between farm and distribution with the help of IOT sensors.
As such, improving the link between farm and distribution can not only support the sector's objectives around food traceability, it can also support both sides in better negotiating contracts, better coordinating crop management, planning harvest logistics, and so on.
In France, a study conducted in 2017 by INRA and CLVC, showed that 97% of people interviewed request more information on the origin of the ingredients they are buying. In this context, one vision could be that – in the not so distant future – consumers could scan their product and see from which farm it comes from, when the crop has been sowed, harvested or transformed, if the plants suffered from any stresses during their development cycle, and how the farmer took care of them.
IOT sensors could play an important role in achieving this vision. The IOT Field Sensors™ co-developed by Bosch and Hiphen collect in almost real-time the type of data inputs that could inform such crop monitoring demands.
Over the past few years, Field Sensors™ have been installed and tested across various crops, projects and countries, collecting data on a daily basis about plant health. The daily images we collect from a single field are firstly used by the technicians to remotely monitor the development of the crop and take action in case a biotic or abiotic stress is detected for instance. Yet, their appications van go way beyond crop that example as, in some projects, IOT devices (which are loaded with sensors) are used to inform crop models aimed at managing fertilization and/or at improving yield prediction among other things.
The type of information collected and processed through the Field Sensors™ provide the level of transparency that not only help to improve the link between farm and distribution, but it also supports a vision in which this link could extend all the way to the consumer.
We would be delighted to tell you more about the amazing Bosch-Hiphen collaboration that led to the development of Field Sensors, and how these powerful devices could potentially support your business goals and field applications.
Please feel free to get in touch with us by email at contact@hiphen-plant.com
We look forward to hearing from you.
High-throughput plant phenotyping is gaining momentum each year among the entire agro-industrial sector and particularly among plant breeders. At Hiphen, we spent the past five years in fields and trial microplots, conducting smart farming experiments or simply flying drones routinely for clients demanding high-value agronomic traits. One of the many lessons we learned over the years is that one cannot pay enough attention to the UAV flight plan.
Too many times we heard companies coming to us to say, 'we need your help, the data we collected is not usable because the images are too blurred ' … or 'we did not use enough ground control points ' … or 'the multispectral images registration failed '.
Most often, we noticed that it is due to the selection of inadequate sensors or an inappropriate set of flight parameters. This is where Hiphen can start to add value in that we are here to support you in getting your UAV plans right from Day1, thus ensuring that your dataset will be usable in the end. Given the large budgets involved in phenotyping campaigns, this is worth considering indeed.

That valuable UAV flight checklist we provide each client with contains more than 20 critical drone and sensor parameters that we define together, by listening to your objectives and constraints. Together, we will review the drone and sensors required based on your budget, based on the traits you are interested in and based on the phenologycal stage at which to acquire the information. Then will follow the set of recommendations in the checklist concerning the appropriate flight altitude, front- and side-overlap, ground sampling distance, time of acquisition, sensor orientation, ground control points, radiometric targets, data structure and upload, and so on.
Your team of drone operators will only have to refer to this simple document when setting up their flight plan in the UAV tablet app, wherever they are in the world – ensuring consistency and quality across datasets. This will be one of the worries we can lift off your shoulders.
We have indeed developed this set of data acquisition protocols and checklist – often referred to as Standard Operating Procedures (SOP) – to make life easier for you and your team, to ensure data quality, and to support you in training your technical staff.
The digital revolution brought by high-throughput plant phenotyping often requires leading agro-companies to in-house new skills. One experienced breeder might be facing the challenge to have to hire a UAV operator to fly drones in several fields across several countries during the entire campaign – something rather unthinkable just a few years ago.
Our clients deciding to in-house data acquisition can benefit from training sessions provided by our experienced UAV operators who guide your technical staff towards the best tactics and methods to to do a fine job at acquiring data (including common mistakes to avoid). The same applies to our partners that decide to outsource data acquisition and need our help to train the third-party they subcontracted to (most of the time not versed in the use of drones for agriculture applications).
Our philosophy goes way beyond just flying a drone, and if you would like to hear more about it and get your very own UAV flight checklist, please get in touch by email at contact@hiphen-plant.com. Lastly, feel free to consult our scientific paper archive that contains tones of information about UAV methods we developed over the past years at CAPTE.
We look forward to hearing from you.
Photo credit: ©Thomas O'Brien – VPA
At Hiphen, we dedicated the past five years to developing innovative methods for plant health measurements and give life to game-changing industrial solutions. Today, we are proud to see Hiphen and Moët Hennessy savoir-faire teaming up to keep making each grape and berry count.
The technology we deployed involves robotics and advanced Deep Learning techniques that can detect the presence of diseases, such as Botrytis, in each crate of grape flowing through the supply chain during harvest. The algorithms we developed therefore provides a quality indicator to each crate of grape and can assist Moët Hennessy experts during the sorting of the grapes at the wine press facilities.
We've made a specific webinar on this topic, so check it out to find out all about this initiative and have the opportunity to ask questions about our AI solution, the Deep Learning techniques we used, and how this type of technology has found its place in Moët Hennessy's unequaled winemaking savoir-faire.
To better understand the vegetation indices for Chlorophyll, we need to take a few moment to introduce you to Chlorophyll. In fact, as you may already know, Chlorophyll is the green pigment present in the leaves and plays an important role in photosynthesis i.e. conversion of light energy to chemical energy. Hence, it is a direct indicator of the plant's primary production and photosynthetic potential. It can be also used to understand the plant's nutrient status, senescence and stress due to water, disease outbreak, etc. Several indices have been developed to estimate the chlorophyll content of the leaves as follows:
The chlorophyll index is used to calculate the total chlorophyll content of the leaves. The CIgreen and CIred-edge values are sensitive to small variations in the chlorophyll content and consistent across most species.
CI green = ρNIR / ρgreen – 1 = ρ730/ρ530 – 1
CI red-edge = ρNIR/ρred_edge – 1 = ρ850/ρ730 – 1
The red-edge band is a narrow band in the vegetation reflectance spectrum between the transition of red to near infra-red.
The total chlorophyll content is linearly correlated with the difference between the reciprocal reflectance of green/ red-edge bands and the NIR band. Hence, a CIgreen- calculated using the observation in the green region (570 nm) and a CIred-edge – using observations in the red-edge (730 nm) are widely used.

The MTCI was designed to estimate chlorophyll content especially from Merris datasets. This index is sensitive to a wide range of chlorophyll concentration since the reflectance from the NIR, red-edge and red bands are used in the calculation.
MTCI =(ρ850-ρ730)/(ρ730-ρ675)

MCARI gives a measure of the depth of chlorophyll absorption and is very sensitive to variations in chlorophyll concentrations as well as variations in Leaf Area Index (LAI). MCARI values are not affected by illumination conditions, the background reflectance from soil and other non-photosynthetic materials observed.
MCARI = ((ρ850-ρ710) – 0.2 × (ρ850-ρ570)) / ρ710
The Normalized Difference Red-Edge Index can be calculated only if the red-edge band is available. The red-edge band is very sensitive to medium to high levels of chlorophyll content.
Hence, red-edge is a good indicator of crop health in the mid to late stage crops where the chlorophyll concentration is relatively higher. Also, the NDRE could be used to map the within-field variability of foliar nitrogen to understand the fertilizer requirements of the crops.
NDRE = (ρNIR-ρred_edge)/(ρNIR+ρred_edge)
The red-edge band is capable of penetrating the leaf better than the red band that is absorbed by the chlorophyll in the first few layers.

The ND705 has a strong linear correlation with FPAR (fraction of Absorbed Photosynthetically Active Radiation) which is an indicator of chlorophyll at the canopy level. ND550 is a good indicator of GAI (Green Area Index). In addition, these indices are sensitive to senescence and are invariant to chlorophyll florescence.
ND705 = (ρ850-ρ730) / (ρ850+ρ730)
ND550 = (ρ850-ρ570) / (ρ850+ρ570)
The ND705 and ND550 are indicators of chlorophyll-a (which is the primary photosynthetic pigment).
This index gives a measure the amount of Chlorophyll-ab content at the field-level from close-range images of mm to cm resolution over sugar beet canopy. The index value is little influenced by the crop canopy structure and thus is insensitive to variations of GF (green fraction) and GAI (Green area index).
mNDblue = -(ρλ – ρ450) / (ρ850 + ρ450) λϵ{530,570,675,730}
Also, in order to know more about vegatation indices in general, we encourage you to read our article about the basics of vegetation indices