A dose-response curve built from a few visual scores on a few dates is easy to challenge. Rate recommendations and marketing claims need a curve dense enough to locate the optimum, show the plateau and catch phytotoxicity as soon as it appears.
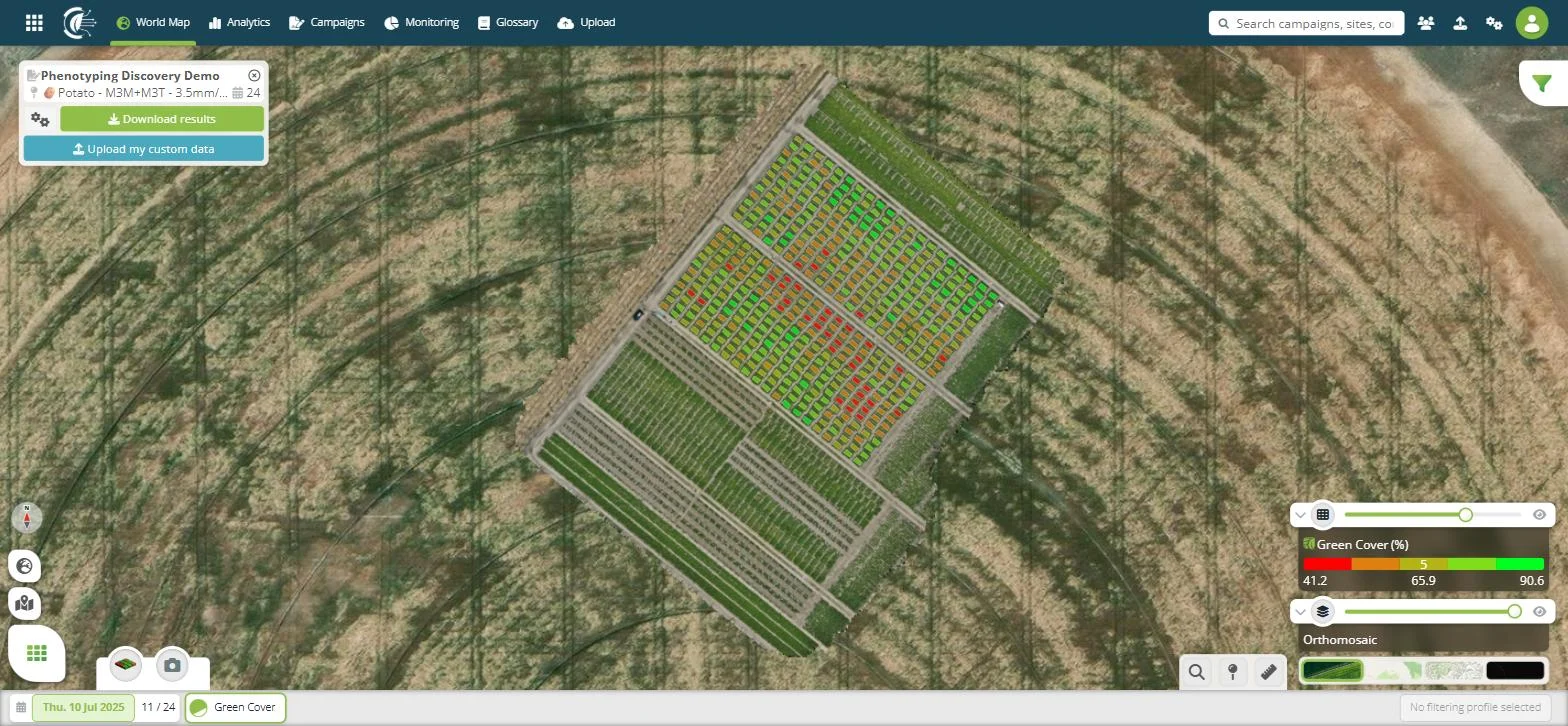
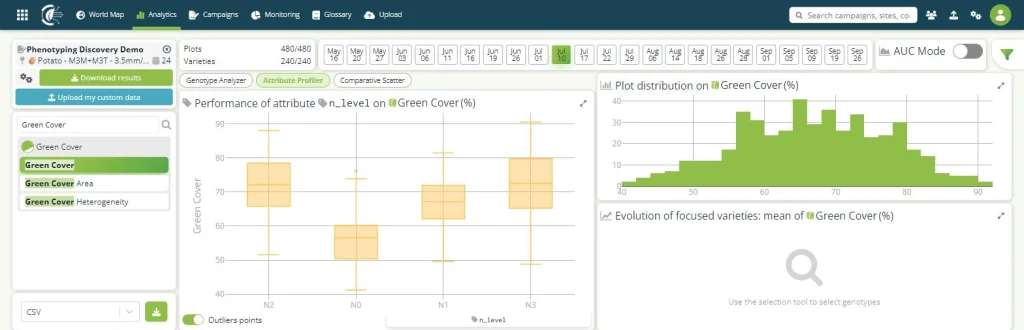
PhenoScale flights measure Green Cover, Plant Biovolume, NDVI and Senescence on every plot of the rate gradient at every date. Cloverfield computes the response per rate over the season, including area-under-the-curve summaries, and runs the analysis of variance across rates and modalities.
The outcome is evidence that stands up to scrutiny and directly supports rate recommendations and marketing claims. On potato, a 1,120-plot trial flown 24 times in one season produced a complete dose gradient with early detection of phytotoxic symptoms.