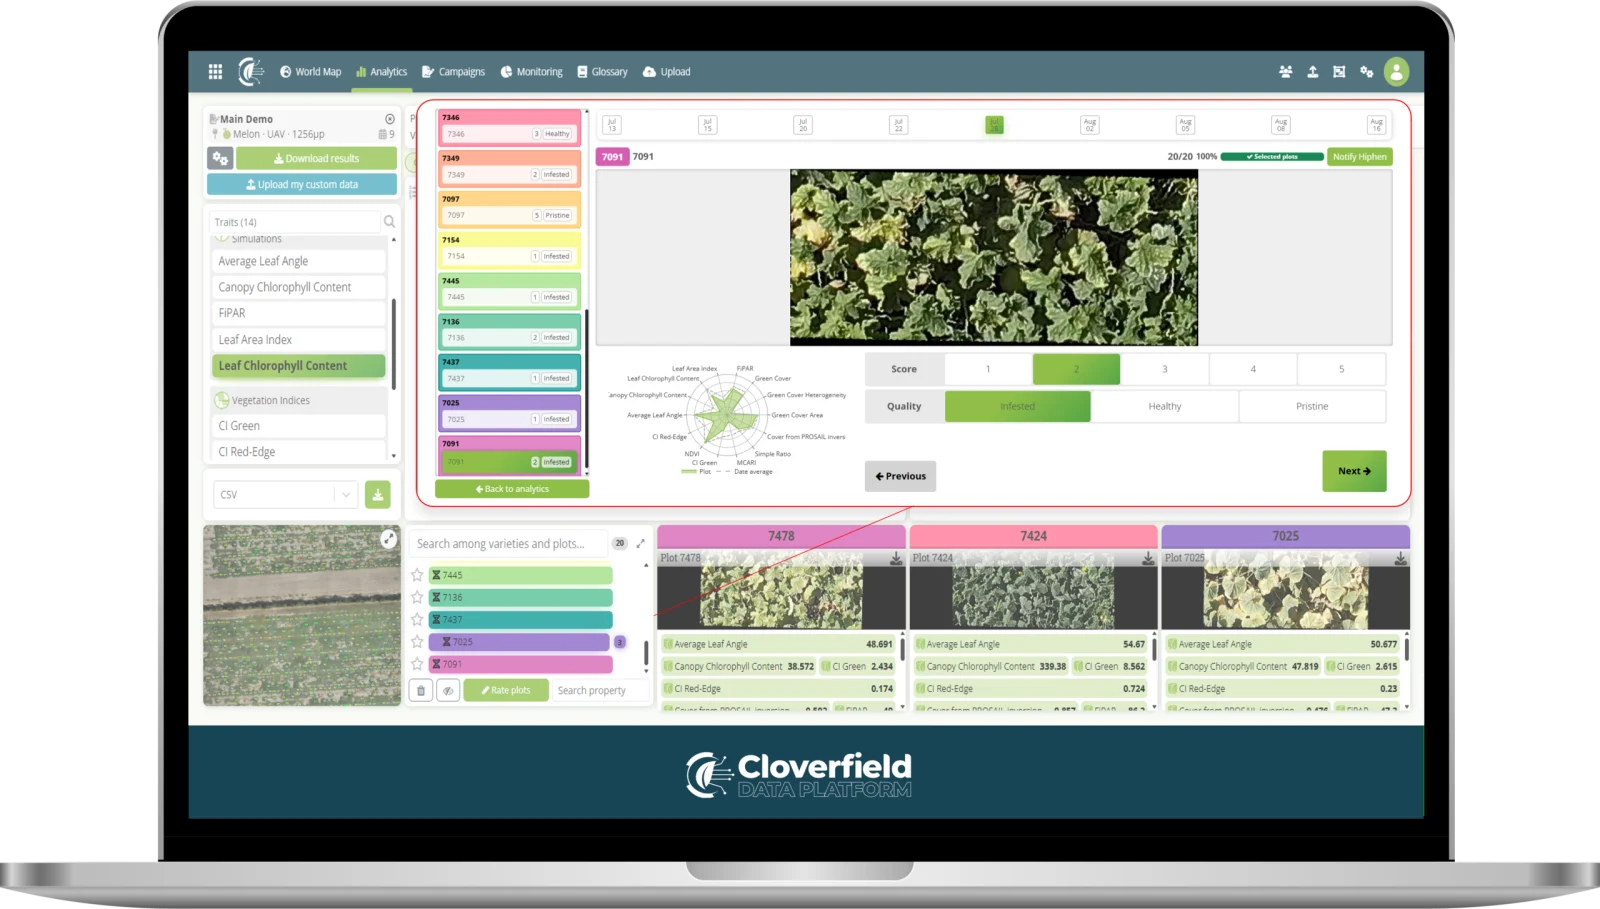
A single-date disease score tells you how bad the epidemic was on the day of the walk. It does not tell you when it started on each plot, how fast it progressed or whether the canopy recovered, which is what resilience actually means.
PhenoScale flights repeated through the epidemic measure Green Cover, NDVI, Senescence and Greenness (VARI) on every plot, without touching the crop. Cloverfield reconstructs the epidemic curve per plot and extracts onset, progression rate and recovery.
Candidates are ranked on genuine resilience, slow disease build-up and sustained canopy function, using selection metrics that single-date visual scoring cannot deliver. Established on a 1,256-plot melon trial flown nine times, and applicable to lettuce and potato.