In potato, sugar beet and vegetable trials, what happens in the field and what comes out of it are measured by different teams, with different tools, at different times. Canopy notes sit in one file, size and defect grades in another, and the link between how a plot grew and the quality it delivered is rarely made, or made by hand weeks after harvest.
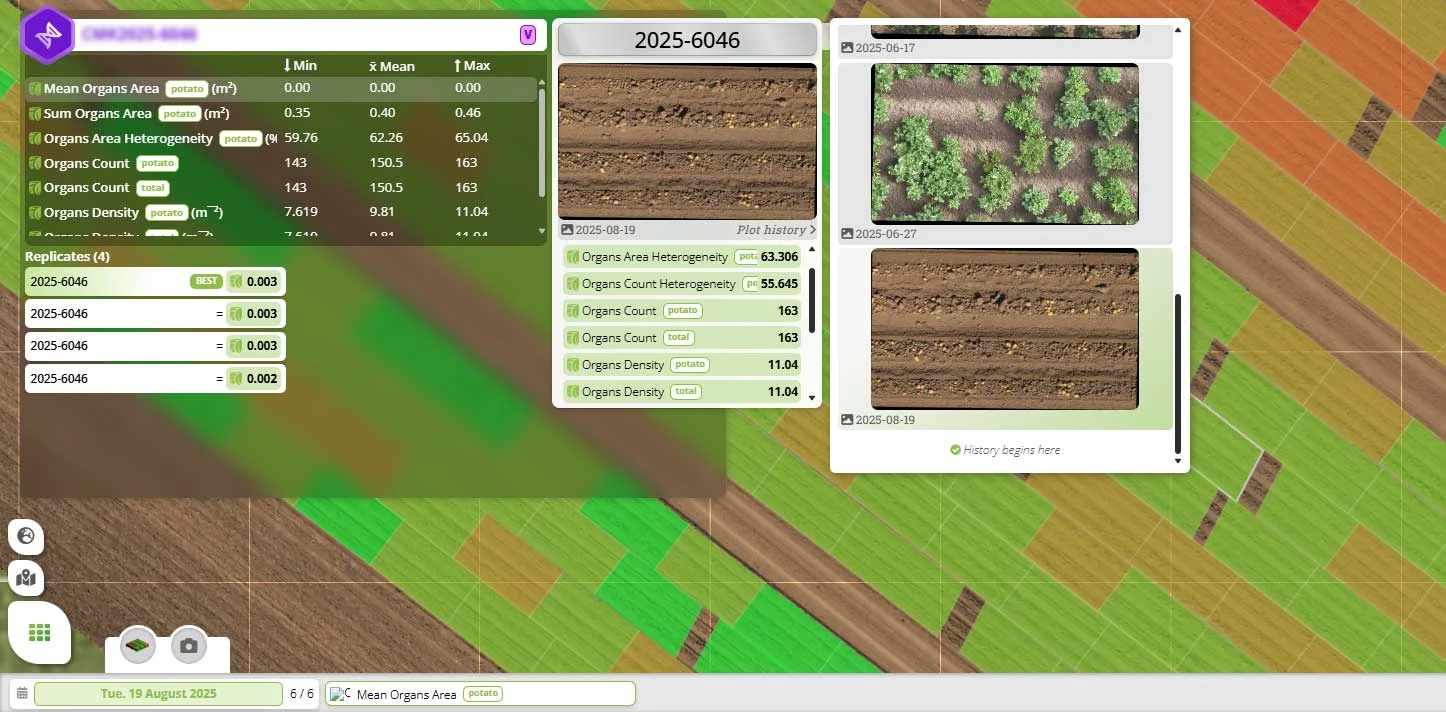
PhenoScale flights repeated through the season measure Green Cover, Mean Plant Height, Plant Biovolume and Senescence on every plot. At harvest, the produce of each plot is imaged to count organs and score size, shape and defects. Cloverfield aligns both on the same plot map and the same timeline.
Teams see which in-season dynamics, early establishment, canopy duration or senescence timing, translate into size, uniformity and defects at harvest. Varieties and treatments are ranked on the quality they deliver, not on yield alone, and the evidence behind every decision sits in one place.