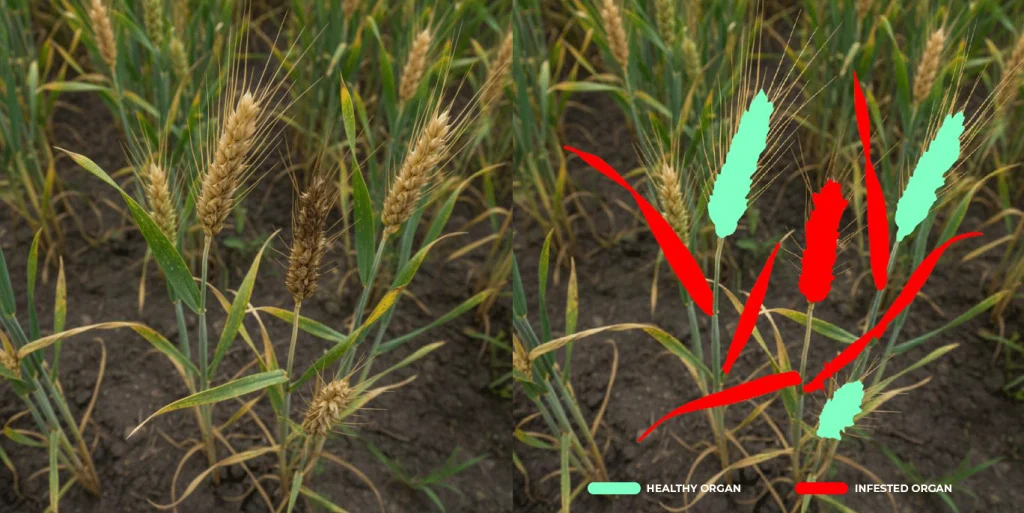
Plot-average disease scores hide most of what a pathologist needs. Two genotypes can share the same canopy-level severity while differing sharply in how symptoms spread across leaves and stems, a difference that visual 1-to-9 scales cannot capture at scale, and certainly not on every plot of a large trial.
PhenoMobile brings high-resolution cameras close enough to the canopy to segment individual organs in the field. AI models trained on annotated symptoms return diseased area, lesion count and necrotic fraction per leaf and stem, and Cloverfield aggregates them into continuous, organ-resolved variables for every plot and every date.
A subjective ordinal note becomes a quantitative phenotype: finer ranking of partial resistance, earlier detection of symptom onset, and variables that feed directly into genomic selection and QTL analysis. On grapevine, potato and wheat, this is the resolution that separates tolerance from true resistance.