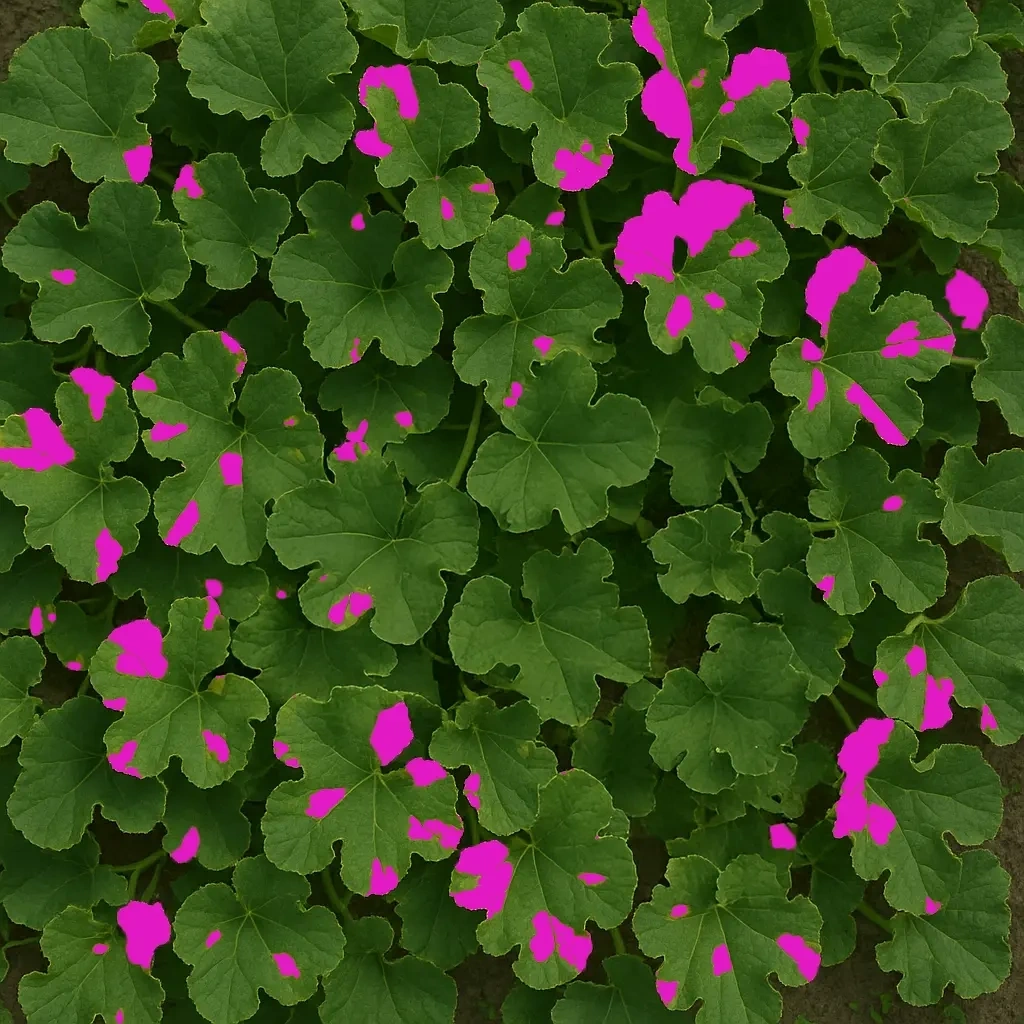
Scoring disease pressure across hundreds of plots by eye is slow and drifts between raters and days. By the time a full campaign has been walked, the epidemic has moved on, and the notation describes a moving target rather than a fixed point in time.
PhenoScale captures the whole trial in a single flight. Vegetation indices, green-cover fraction and senescence dynamics are extracted per plot on every acquisition date, giving a consistent plant-health signal at both image and plot level. In Cloverfield the dates stack into a season-long curve for each plot.
That curve is what breeders and agro-input teams need: area-under-the-curve resistance metrics, objective comparisons between treatments and decisions grounded in continuous data rather than a single visual snapshot. Validated on wheat, maize and soybean trials flown repeatedly through the season.