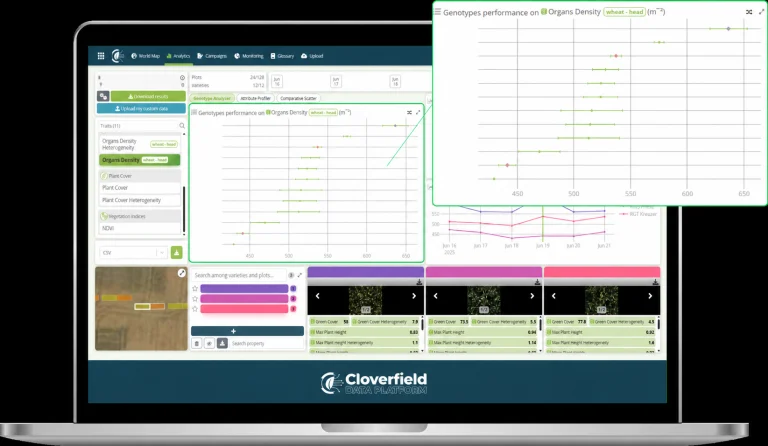
Yield Potential Assessment from Wheat Head Density
Literal measures Organs Density (wheat head density), validated against ground truth across Arvalis research stations, to estimate yield potential and rank genotypes.

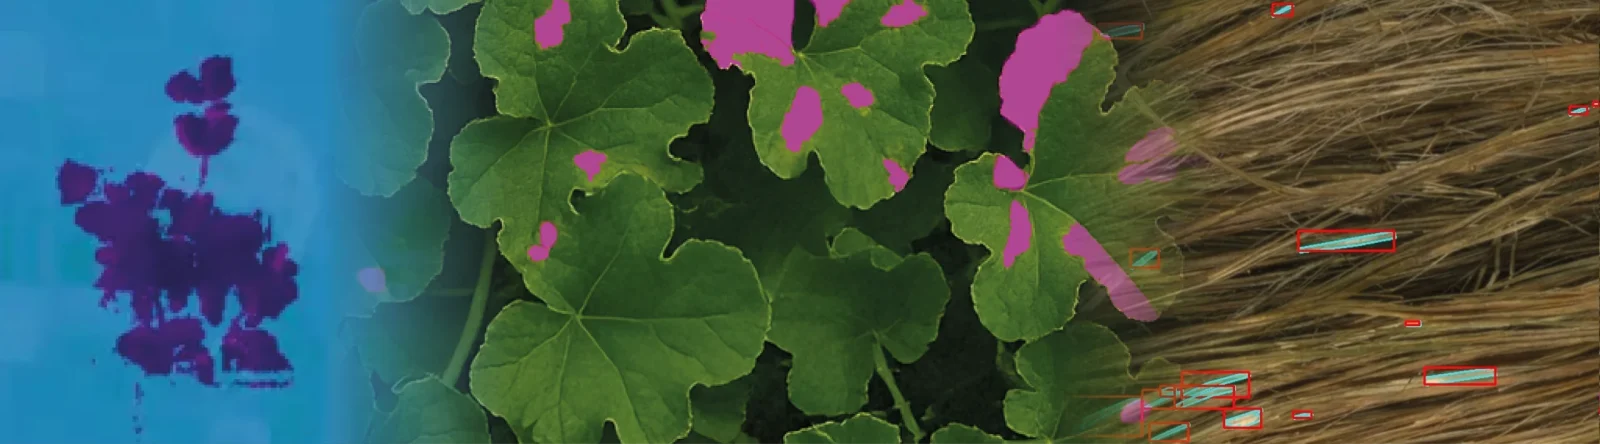
Digital crop assessment use cases from multiple environments, vectors & crops. Image analysis powered by Hiphen Intelligence.
Accelerate your selection decisions with more repeatable, objective, and scalable digital traits, while paving the way toward phenomic prediction.
Key value delivered by Hiphen
Literal measures Organs Density (wheat head density), validated against ground truth across Arvalis research stations, to estimate yield potential and rank genotypes.
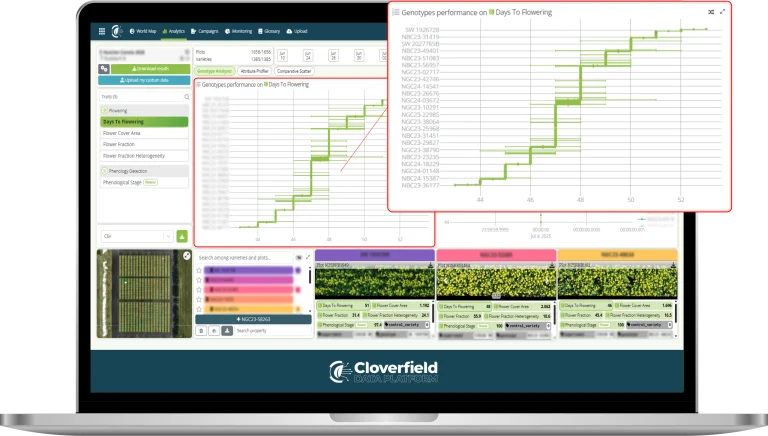
Automated phenology tracking dates flowering plot by plot (onset, flower density, BBCH progression) to improve yield estimation and maturity grouping, with no manual walkthrough.
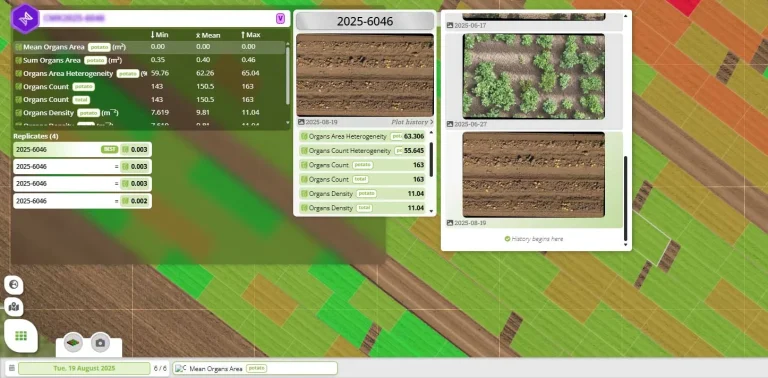
Repeated drone flights track canopy development on every plot, and Cloverfield links each time series to the quality measured on tubers, roots and vegetables at harvest.
Objectively quantify your product performance using validated traits that are measured consistently and are fully comparable across trials, application rates, and environments.
Key value delivered by Hiphen
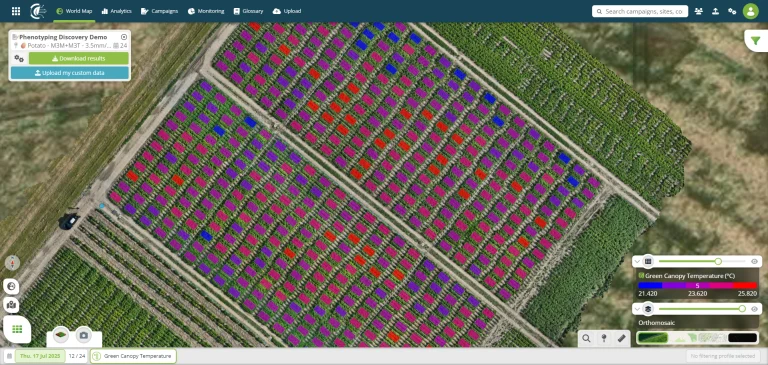
Imaging captures canopy temperature, spectral stress indices, biomass and senescence dynamics across all treatments to quantify drought, heat and nutrient-limitation responses.
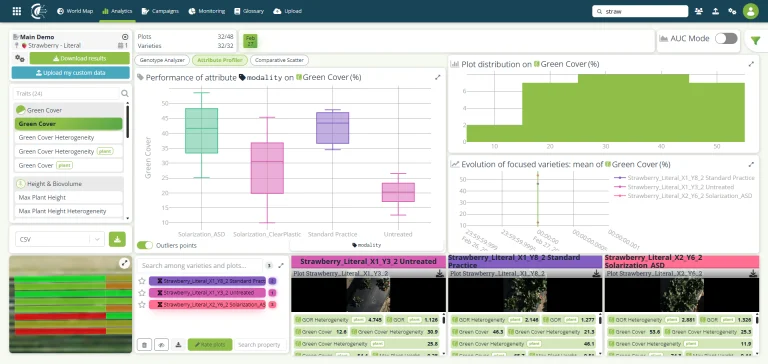
Ground-based phenotyping captures standardized traits on every plot and returns comparable time series for each modality against the commercial benchmark.
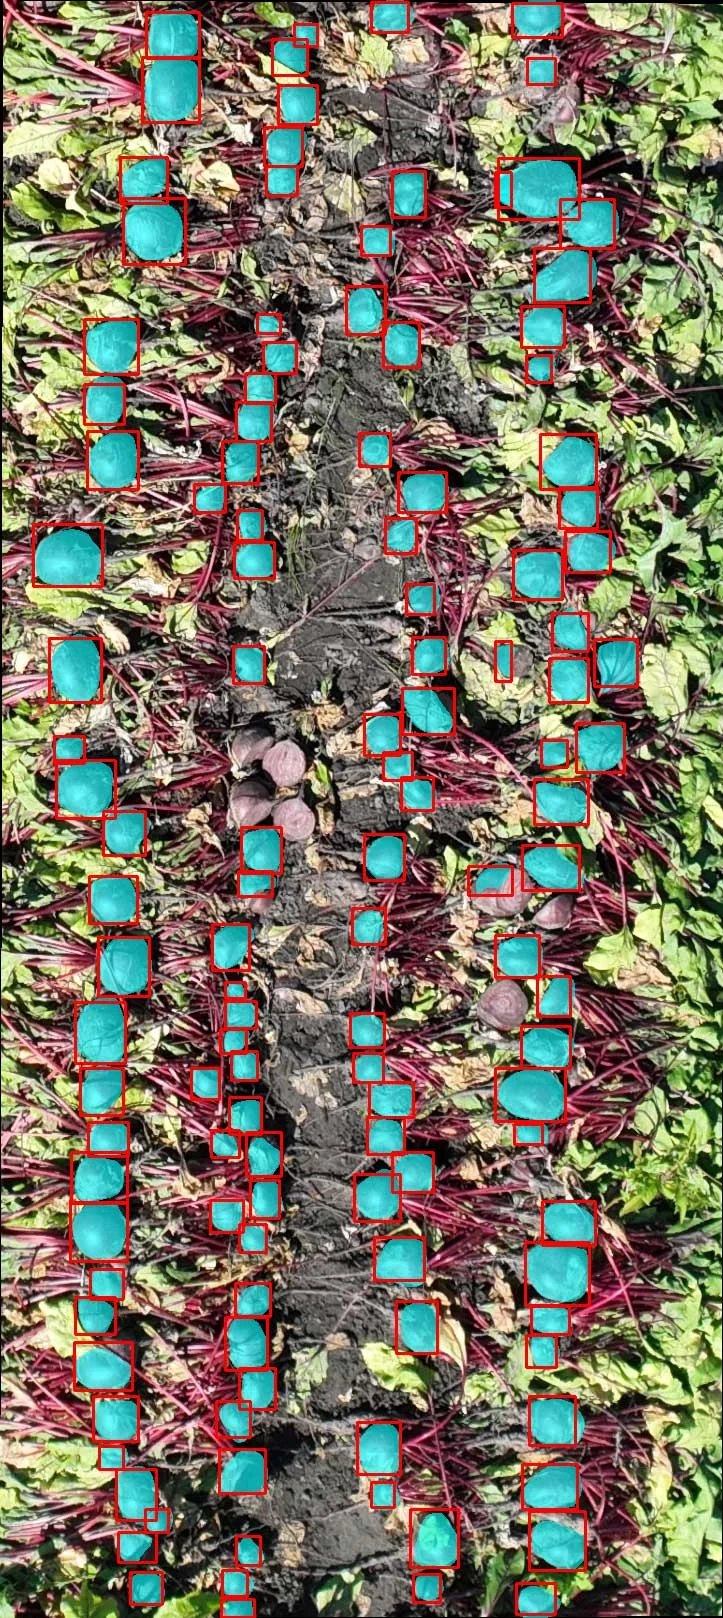
In-field imaging quantifies organ dimensions, shape descriptors, color and defect indicators on every genotype, producing repeatable morphology data without harvesting a sample.
Manage production fields at the individual field scale using a multi-vector approach that combines multiple data sources to better decide where to observe, where to intervene, and how to anticipate harvest outcomes.
Key value delivered by Hiphen
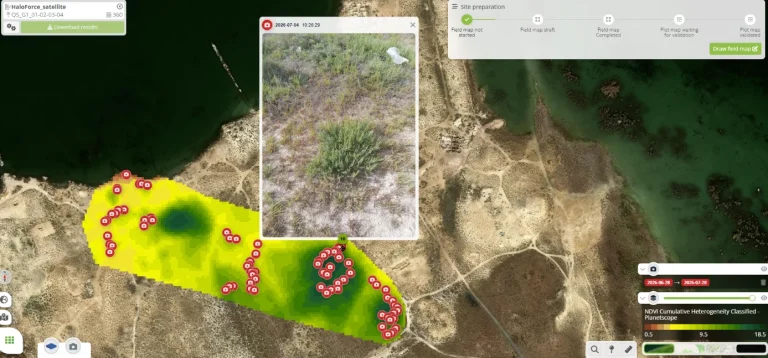
Geolocated smartphone photos from field teams are overlaid on satellite and drone maps in Cloverfield, steering monitoring to confirmed zones of interest.
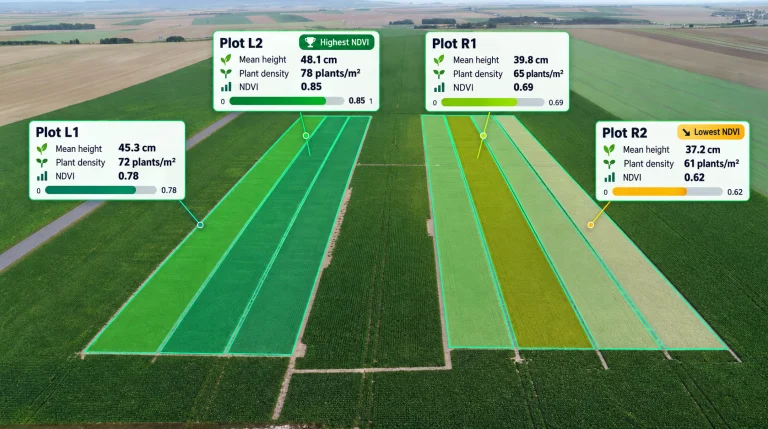
Plant-level phenotyping delivers precise morphology, architecture and vigor traits in strip and non-plot trials to define product usage guidelines before commercialization.
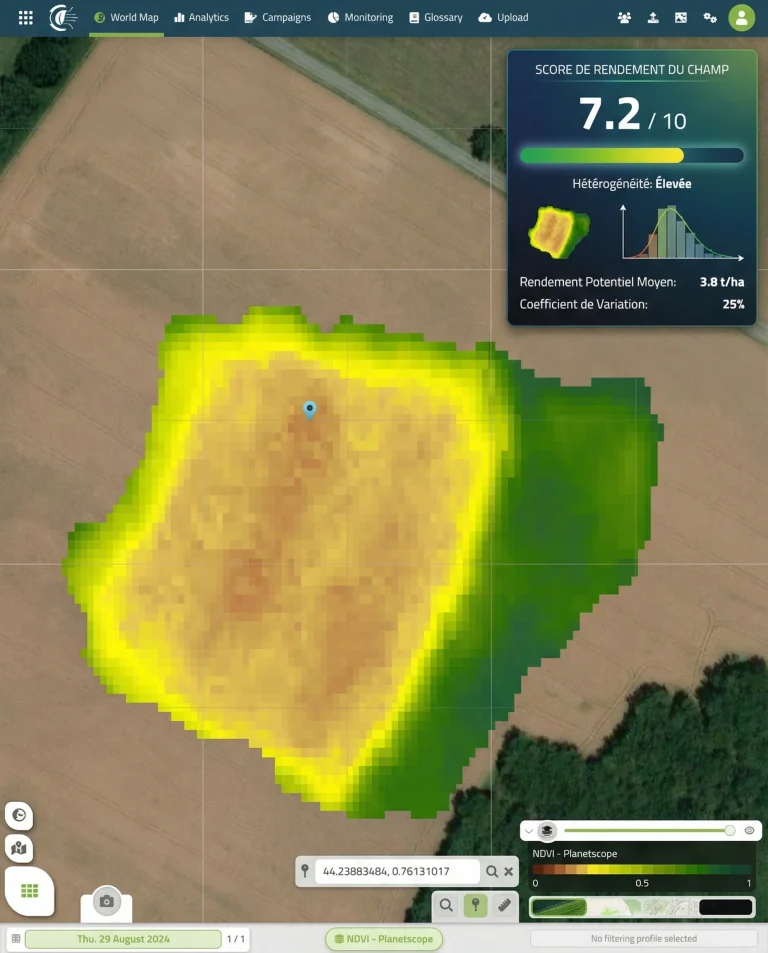
Field-scale imagery maps in-field variability (vegetation indices, biomass, canopy vigor) and delineates homogeneous management zones to define representative sampling zones.
Transform raw agricultural materials into objective data to better manage logistics, enhance quality valorization, and secure industrial decision-making.
Key value delivered by Hiphen
In-field imaging quantifies organ dimensions, shape descriptors, color and defect indicators on every genotype, producing repeatable morphology data without harvesting a sample.
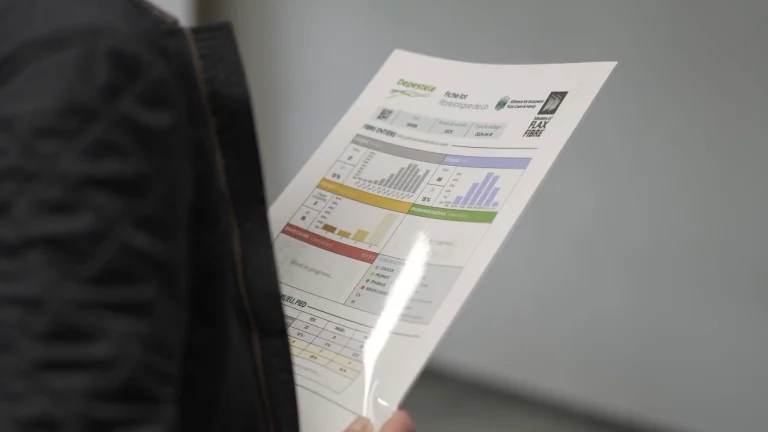
Imaging at the reception line assesses color, morphology and homogeneity in a calibrated setup and compiles them into a standardized score card for each incoming batch of flax fibers.
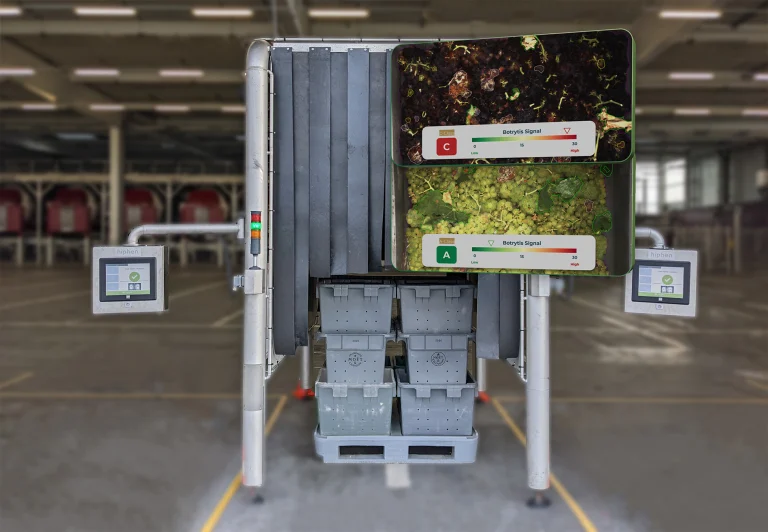
Reception imaging scores incoming grapes for color, bunch morphology and ripeness proxies, producing an objective quality grade for every crate and parcel.